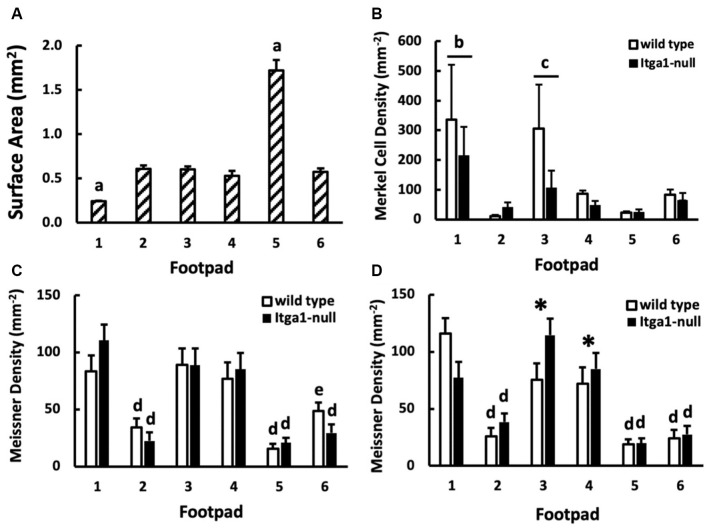
Figure 6.
(A) Surface area (n = 16), (B) Merkel cell density (n = 3), and (C,D) Meissner-like corpuscle density across footpads 1–6 (n = 4). Merkel cell density is further compared between genotypes (wild type, itga1-null; B) and Meissner-like corpuscle density between genotypes and sexes [female (C), male (D)]. Values are means with standard error bars. aDifferent from all other footpads (p < 0.01). bDifferent from all footpads except footpad 3. cDifferent from footpad 2 and 5. dDifferent from footpads 1, 3, 4 (p < 0.05). eDifferent from footpads 1, 3, 4 (p < 0.05) except footpad 4 equivalent and different from footpad 5 equivalent. *Different from genotype equivalents (p < 0.01).

