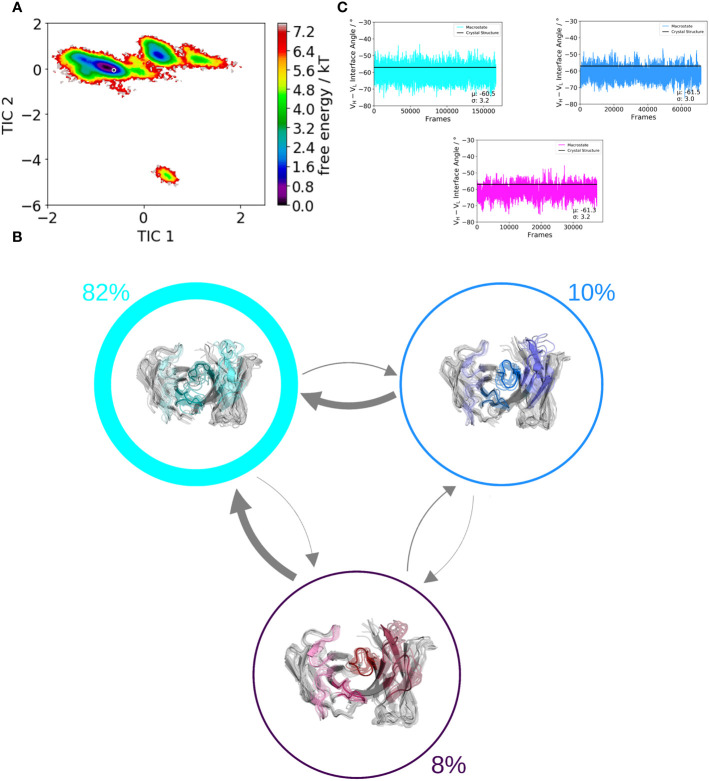
Figure 3.
Paratope states in solution of the mutant antibody Fab, characterized by the free energy surface, the respective Markov-state model and the relative VH–VL interdomain orientations. Panel (A) shows the free energy surface of the whole paratope based on the backbone torsions of all CDR loops. Both the human germline IGHV1-69/IGKV1-39 antibody ( Figure 2 ) and the mutant are projected into the same coordinate system. The gray dot represents the starting structure (PDB accession code: 5I15). Panel (B) illustrates the Markov-state model including the respective state probabilities. The transitions between different paratope states in solution occur in the micro-to-millisecond timescale and are represented by the thickness of the arrows. The macrostate arrangement corresponds to the free energy surface in panel (A). Panel (C) depicts the relative VH–VL interdomain orientations of the individual macrostates color-coded according to panel (B).

