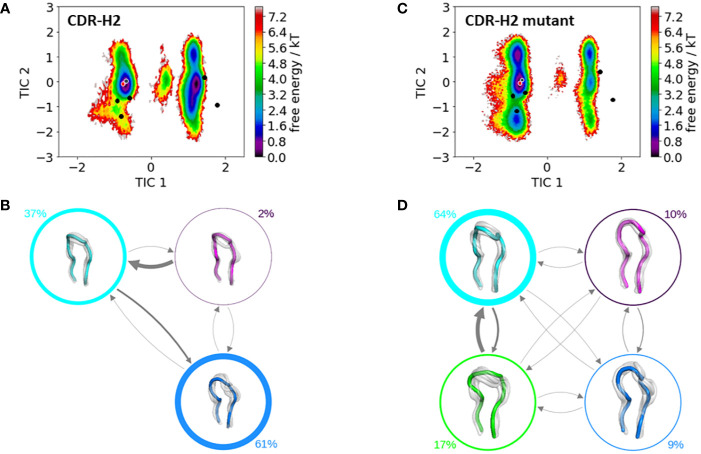
Figure 5.
Comparison of the free energy surfaces and Markov-state models of the CDR-H2 loop of both the human germline IGHV1-69/IGKV1-39 antibody Fab and the mutant. Panel (A) illustrates the free energy surface of the CDR-H2 loop of the human germline antibody. The red dot represents the assigned canonical cluster structure (PDB accession code:2BDN), while the black dots represent all other available canonical cluster structures with a CDR-H2 loop length of 10 residues. The gray dot represents the starting structure (PDB accession code: 5I15). Panel (B) shows the corresponding macrostate ensembles with the respective state populations. The thickness of the circles reflects the state population. The thickness of the arrows corresponds to the transition timescales, which are in the micro-to-millisecond timescale. Panel (C) shows the Markov-state model of both the human germline and the mutant CDR-H2 loop, including the respective state probabilities. Again, the black dots represent all available canonical cluster structures of the CDR-H2 loop with a loop length of 10 residues, while the red dot shows the assigned canonical cluster structure (PDB accession code: 2BDN). The gray dot represents the starting structure. Panel (D) depicts the respective macrostate ensembles with respective state populations. The thickness of the circles reflects the state population. The thickness of the arrows corresponds to the transition timescales, which are in the micro-to-millisecond timescale.

