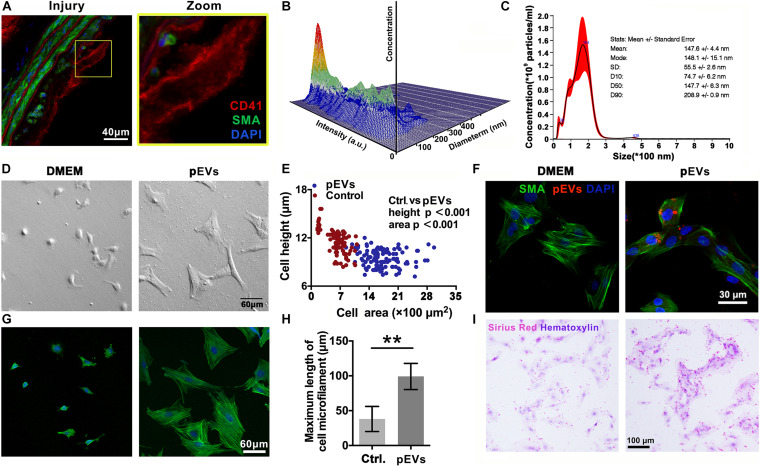
FIGURE 2.
pEVs interacted with VSMCs to promote collagen secretion. (A) Immunofluorescence staining was used to examine the adhesion of VSMCs in situ compared with that in the control group. Green indicates SMA staining (VSMCs), red indicates CD41 staining (pEVs), and nuclear staining is shown in blue by DAPI (bar = 40 μm). (B,C) Nanoparticle tracking analysis (NTA) was used to examine the concentration and size distribution of the pEVs. The results revealed that most of the pEVs were between 100 and 300 nm in size. (D,E) Cell morphological analysis revealed the adhesion of VSMCs to glass culture dishes after pEV stimulation. The area and height of cell adhesion were measured by the confocal microscope. After pEV stimulation, more VSMCs adhered and spread on the surface of the glass plate compared with the control (bar = 60 μm). (F) pEVs significantly adhered to VSMCs at 1 h. Red fluorescence shows the pEV membranes, which were labeled with the fluorescent cell linker PKH26, green fluorescence shows SMA staining (VSMCs), and blue fluorescence shows DAPI-labeled nuclei (bar = 30 μm). (G,H) Microtubule staining showed changes in microtubule length, and more bundles of long microtubules were present in the VSMCs stimulated by pEVs than in unstimulated cells (bar = 60 μm). (I) Picrosirius red staining was used to analyze whether VSMC collagen secretion changed after pEV stimulation. Compared with unstimulated VSMCs, VSMCs stimulated with pEVs secreted more collagen (bar = 100 μm). The values are shown as the mean ± SD, *P < 0.05, **P < 0.01 vs. control (n = 4 biological replicates).

