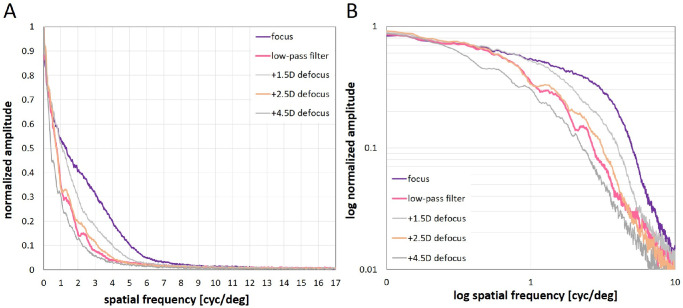
Figure 3.
Spatial frequency spectra of the movies, as determined by Fourier analysis and radial averaging in the two-dimensional spatial frequency amplitude plots obtained from ImageJ. (A) linear plots and (B) log-log plots of spatial frequency amplitudes plotted against spatial frequencies. Note that differences between movies in focus (purple curves), low pass filtered movies (pink), and defocused movies (orange and gray) were confined to the spatial frequency range between 1 and 10 cyc/deg. Note also that the calculated low pass filter (pink) generated a spectrum similar to the targeted defocus of +2.5 D (orange).

