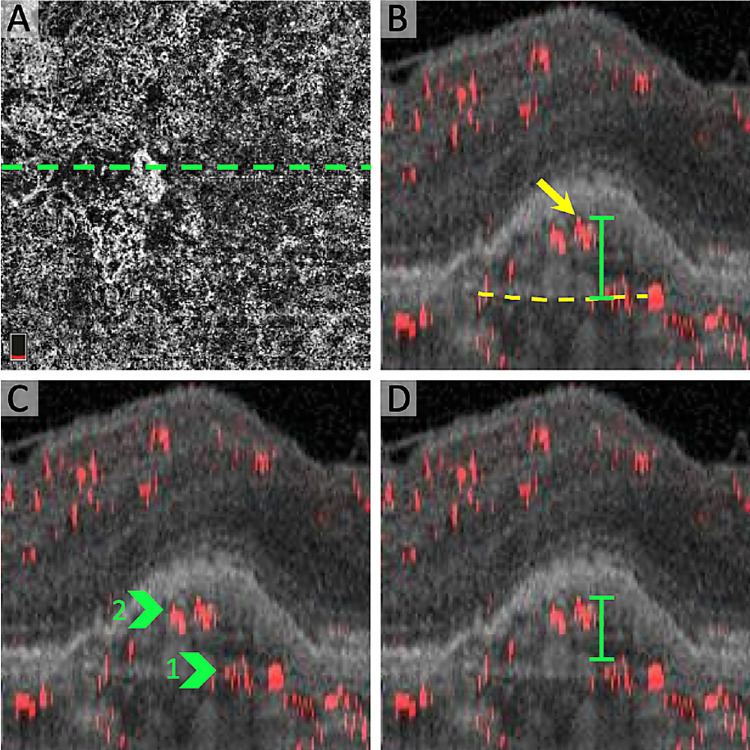
Figure 3.
CNV complexity parameters in projection-resolved OCTA. (A) En face OCTA of the choriocapillaris with CNV and location of B-scan (dotted line). (B) Cross-sectional projection-resolved OCTA showing the “highest CNV flow signal,” defined as the distance between Bruch's membrane (dotted yellow line) and the most anterior CNV decorrelation signal (yellow arrow). (C) Cross-sectional projection-resolved OCTA highlighting two “CNV flow layers” (green arrows). (D) Cross-sectional projection-resolved OCTA with “CNV flow signal thickness,” defined as the distance between the two most anterior CNV flow layers (green).

