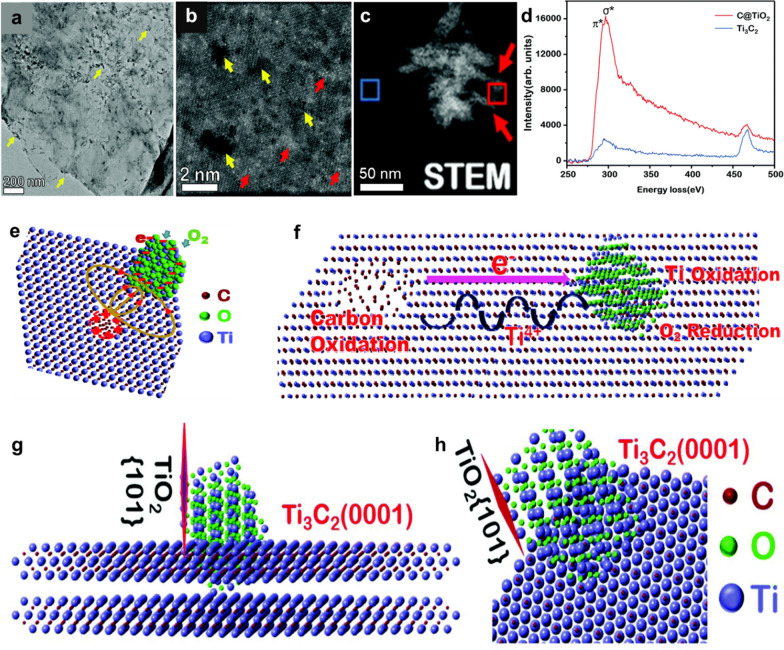
Fig. 3.
a Bright-field TEM image of Ti3C2 MXene flakes showing the formation of TiO2 nanoparticles on edges as well as on the basal plane. b A Z-contrast STEM image showing the Ti-vacancies (dark contrast marked by yellow arrowheads) and Ti–rich areas (bright contrast marked by red arrowheads). c HAADF-STEM image and elemental maps of C, O, and Ti collected by EELS, showing the coexistence of TiO2 nanoparticles and amorphous carbon aggregation. d A comparison of EELS spectra, collected from the carbon aggregation marked by the red box in c and the Ti3C2 substrate marked by the blue box. e Schematic of the internal electric field, with the positive side formed around a hole with many Ti-vacancies and the negative side with the accumulation of electrons on the convex particle. f Illustration of Ti3C2 oxidation with carbon being oxidized on the positive side of the internal electric field and Ti-ions being oxidized on the negative side. g, h Illustration of the TiO2 cluster on Ti3C2 with the TiO2-(101) plane perpendicular to the MXene basal plane (0001). a–h are reproduced with permissions from ref. [52]. Copyright (2019), Royal Society of Chemistry

