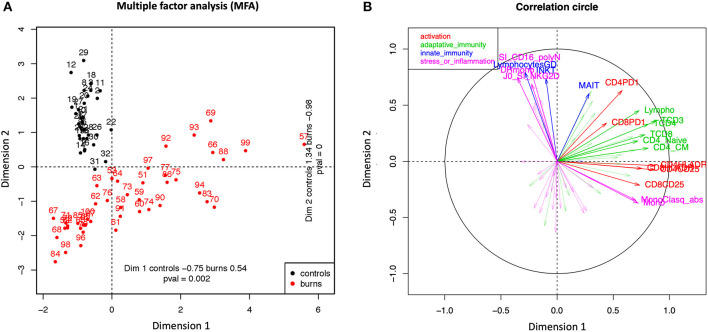
Figure 1.
Multiple Factor Analysis (MFA). The analysis was based on 69 biomarkers and 76 individuals (healthy volunteers and burn patients at D0). (A) Healthy Donors (black dots) and burn patients (red dots) are presented as points on the scatter plot created with the first two main dimensions of Multiple Factorial Analysis (MFA). This analysis displayed the variability within the group of burn patients through dimension 1 (index of repartition: 0.54) whereas all controls are less spread in dimension 1 (controls: 0.75). (B) The correlation circle was generated using the most discriminating biomarkers between the two groups of individuals. The biomarkers were classified in four groups: activation markers (red), adaptive immunity markers (green), innate immunity markers (blue) and stress or inflammation markers (pink).

