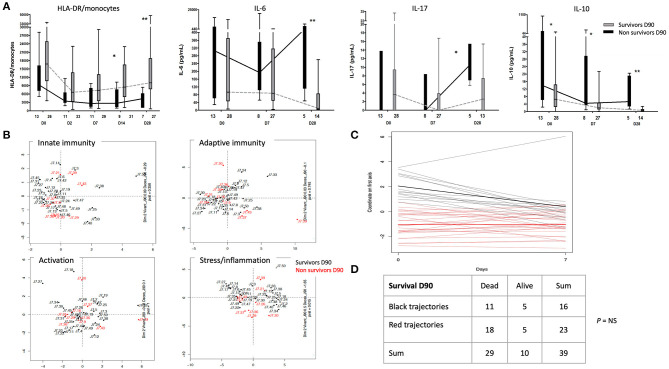
Figure 3.
Association between immune profiles and mortality. (A) Patterns of monocytes HLA-DR and serum cytokine levels between survivors (in gray) and non-survivors (in black) at day 90. Comparison of the number of HLA-DR molecules per monocyte (HLA-DR/monocytes), IL-10, IL-6, and IL-17 from day (D) 0 to D28 between burn patients who survived at day 90 or not. The number of patients is indicated below each plot. (B) Survivors (black dots) and non-survivors (red dots) at day 90 are presented in the first two dimensions of MFA of each four predefined subsets of immune markers. (C) Comparative trajectories from D0 to D7. Two classes of trajectories, red and black, were defined by k-means clustering. (D) Contingency table displaying patients with red or black trajectory depending on whether they survive at D90. *p < 0.05; ** p < 0.001.

