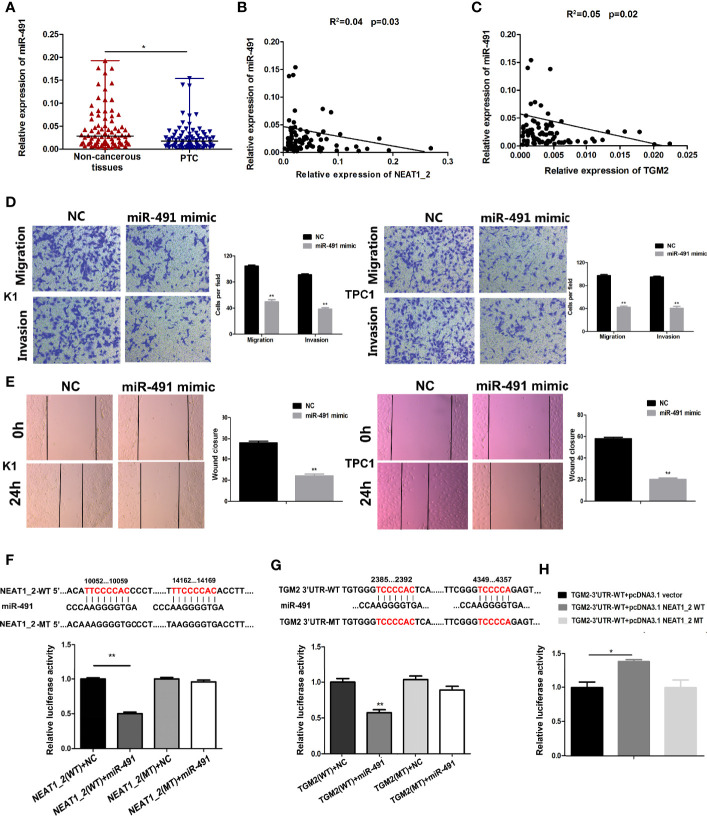
Figure 5.
miR-491 inhibited PTC migration and invasion and could directly bind to NEAT1_2 and the 3′ UTR of TGM2. (A) The relative expression levels of miR-491 in 80 pairs of PTC tissues and adjacent non-cancerous tissues, as determined using qRT-PCR. The Wilcoxon signed-rank test was used to analyze the differences between the two groups; data are presented as the median with a range. *P < 0.05. (B) Pearson’s correlation analysis was performed to analyze the correlations between NEAT1_2 and TGM2 expression in PTC tissues (R2 = 0.056, P = 0.042). (C) Pearson’s correlation was performed to analyze the correlations between miR-491 and TGM2 expression in PTC tissues (R2 = 0.05, P = 0.029). (D) Transwell assays were used to evaluate the migration and invasion in PTC cells after transfection with miR-491 mimics or NC. Data are presented as the mean ± S.D., as analyzed using an independent samples t-test. **P < 0.01 versus NC. (E) A wound healing assay was applied to analyze the migration capacity in PTC cells after transfection with miR-491 mimics or NC. All data are presented as the mean ± S.D. (F) The predicted miR-491 binding sites in NEAT1_2 (NEAT1_2-Wt) and the designed mutant sequence (NEAT1_2-Mt) are indicated. HEK 293T cells were transfected with NEAT1_2-Wt, NEAT1_2-Mt, and the indicated miRNAs, and then a luciferase reporter assay was conducted. Data are presented as the mean ± S.D., as analyzed using an independent samples t-test. **P < 0.01 versus NEAT1_2-Wt+NC. (G) The predicted miR-491 binding sites in the 3′-UTR region of TGM2 (TGM2-3′UTR-Wt) and the designed mutant sequence (TGM2-3′UTR-Mt) are indicated. HEK 293T cells were transfected with TGM2-3′UTR-Wt or TGM2-3′UTR-Mt and the indicated miRNAs, and then a luciferase reporter assay was conducted. Data are presented as the mean ± S.D., as analyzed using an independent samples t-test. **P < 0.01 versus TGM2-3′UTR-Wt+NC. (H) TGM2-3′UTR-Wt was cotransfected with vectors pcDNA3.1, pcDNA3.1-NEAT1_2 Wt, and pcDNA3.1-NEAT1_2 Mt, respectively, and then a luciferase reporter assay was conducted. Data are presented as mean ± S.D., as analyzed using an independent samples t-test. **P < 0.01 versus TGM2-3′UTR-Wt+pcDNA3.1 vector.

