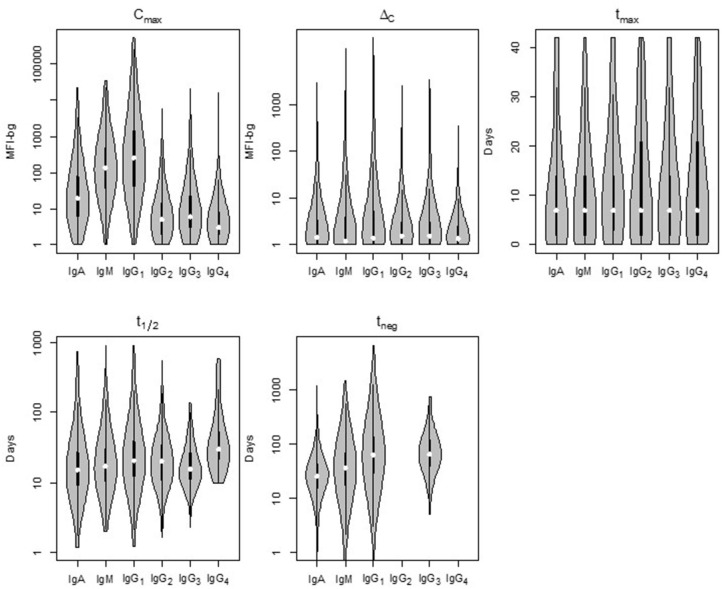
Figure 3.
Distribution of the five post-treatment clearance parameters by Ig isotype/subclass for antibodies to malaria antigens in Angolan children treated for Plasmodium falciparum malaria. Violin plots display data for all P. falciparum antigens with the median estimate as a white point, black bars as the interquartile range (IQR), and whiskers extending 1.5 × IQR. Plots occasionally do not exist for IgG2 and/or IgG4 as not enough children samples provided quantifiable assay signals for these subclasses. Statistical comparison among isotypes shown in Supplementary Table 2. MFI-bg: median fluorescence intensity minus background assay signal.

