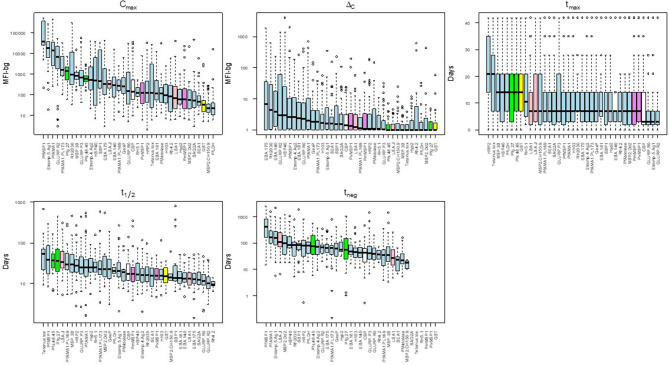
Figure 4.
Distribution of acquisition and decay parameters for IgG1 to different antigens in Angolan children treated for malaria. Antigens are color-coded by category: sporozoite (white), hepatic (pink), erythrocytic (blue), gametocyte (green), non-falciparum Plasmodium (violet) and other control (yellow). Boxplots display median as black solid line with box length representing interquartile range (IQR) and whiskers 1.5 × IQR. Outliers above or below 1.5 × IQR represented as circles. MFI-bg: median fluorescence intensity-background. Plots for parameter estimates for IgM, IgA, and IgG3 shown in Supplementary Figures 3–5, respectively.

