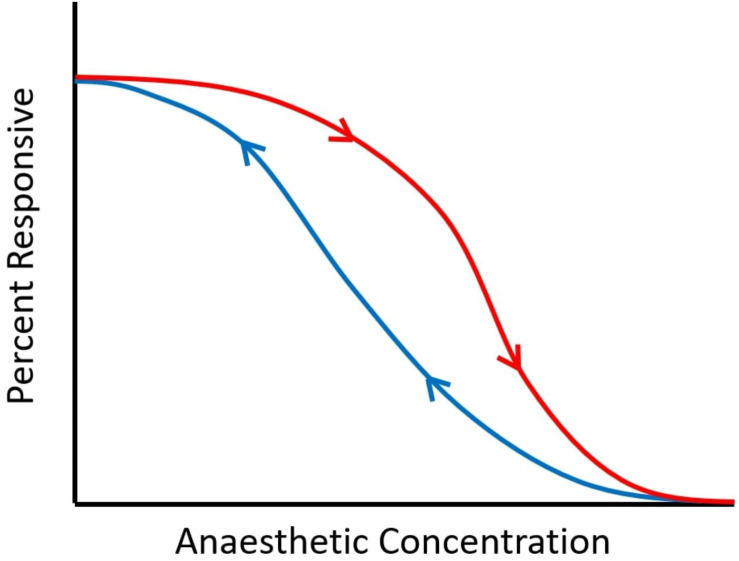
FIGURE 2.
Schematic of neural inertia. As anaesthetic dose is increased, responsiveness is diminished. However, the dose at which a certain proportion of responses is observed is not the same for induction (downward arrow, in red) and emergence (upward arrow, in blue), indicating path-dependence (hysteresis). Between the two curves, subjects may be awake or anaesthetised, depending on whether the drug concentration is being increased or decreased. The wider the gap between the two curves, the greater the hysteresis.

