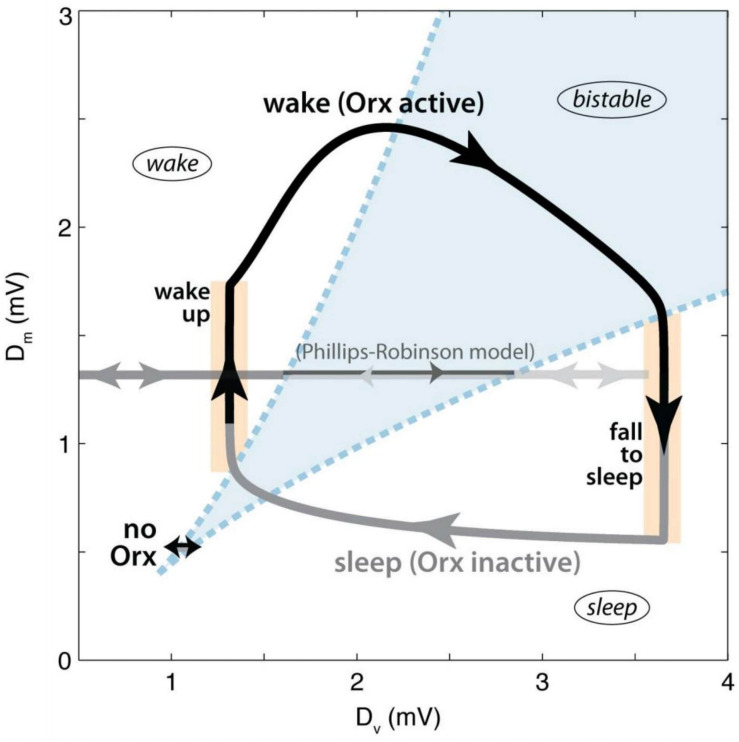
FIGURE 5.
Dynamics of orexin stabilisation of state transitions according to the model of Fulcher et al. (2014). The axes represent the net drives to the wake-promoting (DM) and sleep-promoting (DV) circuits. Regions are labelled, with the bistable region shown in blue. The black arrow represents the waking period, while the grey arrow represents sleep. The trajectory marked “no Orx” represents the dynamics of the model in the absence of orexin input. Figure adapted from Figure 3 of Fulcher et al. (2014), published under CC-BY licence.

