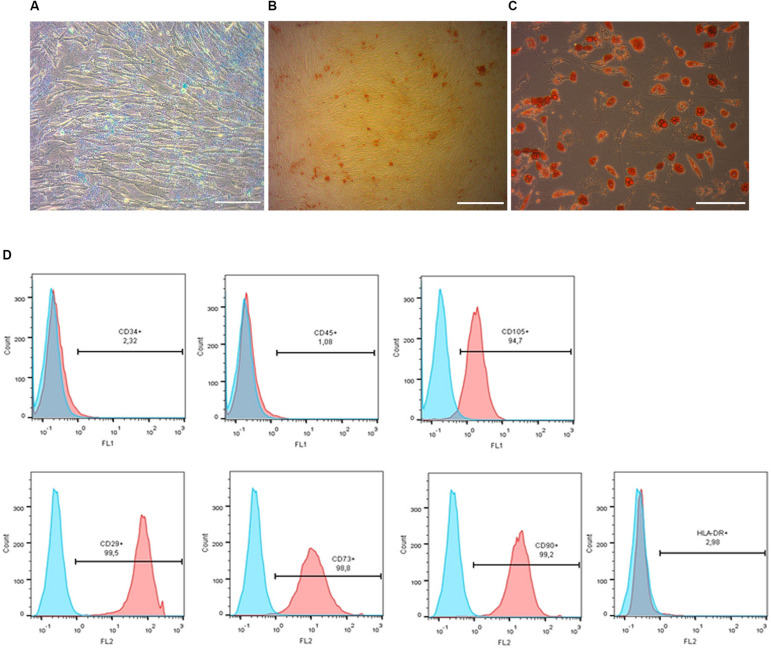
FIGURE 2.
Phenotypic characterization and differentiation of pMSC. Chondrogenic (A), osteogenic (B) and adipogenic (C) differentiation of pMSC, revealed by Alcian Blue, Alizarin Red and Oil Red staining, respectively. Scale bar = 100 μm. Flow cytometry analysis of the pMSCs’ surface antigen expression (D). Most cultured cells were positive for surface antigens typically expressed by mesenchymal stem cells: CD105+, CD29+, CD73+, CD90+ and negative for non-mesenchymal CD34- and CD45- markers. Blue graphs represent negative control (isotypic immunoglobulins); pink graphs – experimental samples.

