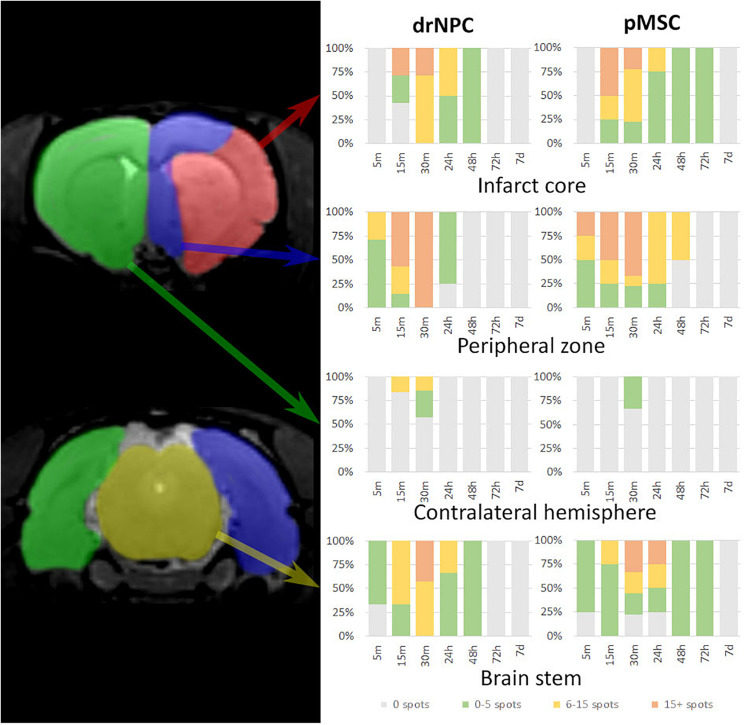
FIGURE 3.
Diagrams of labeled drNPC and pMSC distribution during the entire observation period. The colors on the diagram indicate the number of hypointensive spots on SWI (zones of SPIO-labeled cell presence) in a particular area of the rat brain. The areas are schematically marked on the left images. Cell accumulation inside cerebral blood vessels started from 5 min onward after start of IA infusion. Neither drNPC nor pMSC seemed to undergo long-term homing: no drNPCs were observed within the brain more than 48 h after transplantation and no pMSCs could be seen after 72 h.

