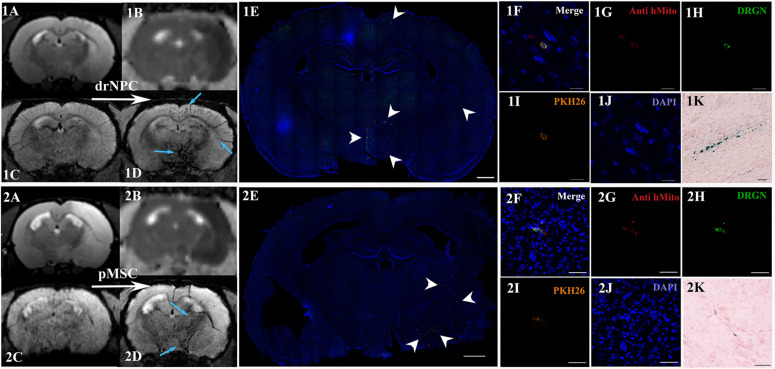
FIGURE 4.
Distribution of drNPC and pMSC in the rat brain 30 min after IA transplantation. MRI and histological images of the rat brain before and after drNPC (top panel row) and pMSC (bottom panel row) infusion. (1A,2A) T2 WI of the rat brain before transplantation; the hyperintense zone corresponds to ischemic brain injury. (1C,2C) SWI of the rat brain before cell transplantation. (1B,2B) ADC maps (calculated from DWI) 30 min after cell transplantation; no new zone of cytotoxic edema and therefore no embolic infarction were detected. (1D,2D) SWI of rat brain 30 min after cell transplantation, blue arrows indicate hypointense zones of SPIO-labeled cell accumulation. Panoramic confocal fluorescence images of the coronal sections cut through the rat’s forebrain 30 min after transplantation of drNPC (1E) or pMSC (2E). White arrowheads indicate double-labeled cells in the ischemic core and to the periphery of it. Scale bars: 1,000 μm. (1F–1J,2F–2J) High-magnification confocal fluorescent images of transplanted cells inside cerebral blood vessels. To validate the MRI data and check its consistency with the microscopy results, cells were double-labeled with the membrane dye PKH26 (orange), and SPIO microparticles fluorescent marker Dragon Green (green, present in the cytoplasm). Transplanted human cells were also stained using antibodies against human mitochondria (red). The scale bars: 20 μm for panels (1F–1J) and 50 μm for panels (2F–2J). (1K,2K) Bright-field microscopy of Perls’ Prussian Blue stained sections showing SPIO accumulation (blue) in the brain. Scale bar: 50 μm.

