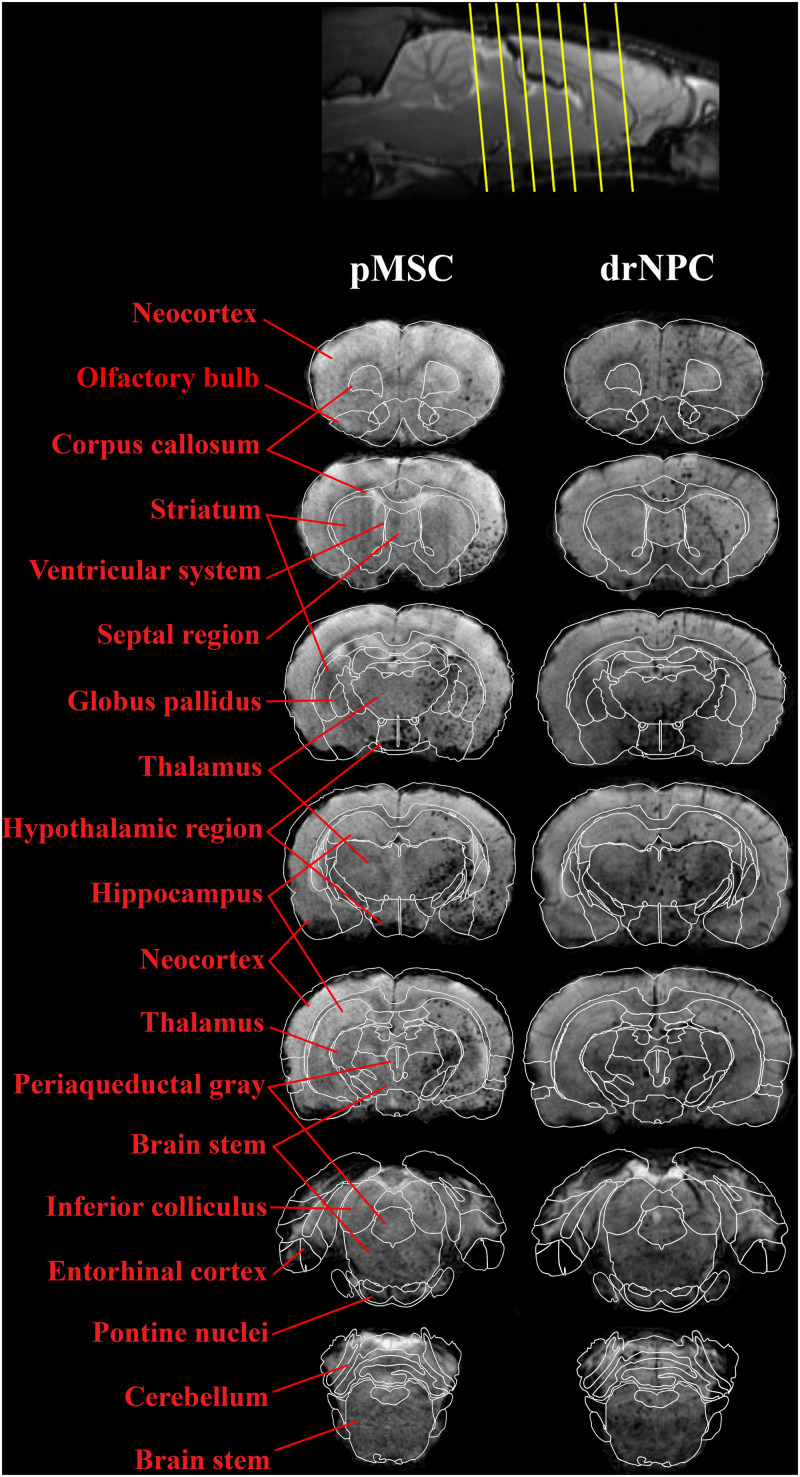
FIGURE 5.
Overall distribution of drNPC and pMSC in the rat brain in relation to the anatomical structures. SWI MRI 30 min after IA injection of drNPC (the right column) and pMSCs (the left column), 7 coronal sections (levels are marked with yellow lines on the top). SPIO labeled cells are hypointense (dark) spots on SWI. Brain structures were signed in red and depicted with white lines on the base of “the Scalable Brain Atlas” (Papp et al., 2014; Bakker et al., 2015; Sergejeva et al., 2015).

