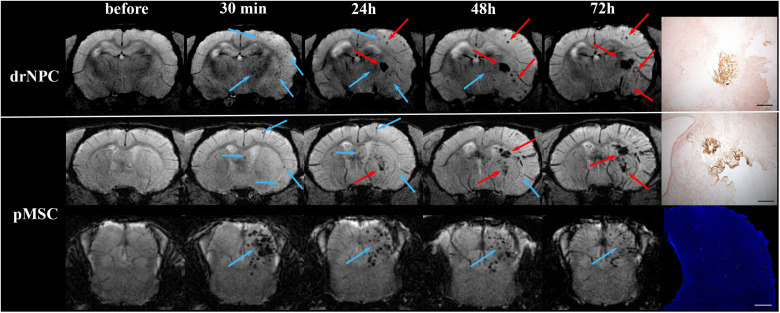
FIGURE 8.
Dynamic distribution of drNPC and pMSC in the rat brain. SWI MR-images before and 30 min, 24 h, 48 h, 72 h after transplantation. Upper row: SWI coronal slices at the level of the forebrain after drNPC infusion. Bottom row: SWI coronal slices at the level of the forebrain and brain stem. Blue arrows indicate SPIO-labeled cell accumulation. drNPC persist in the brain up to 48 h; pMSC a little longer, up to 72 h. MRI data was verified by confocal microscopy (bottom row, scale bars: 500 μm). Red arrows indicate hemorrhagic transformations of ischemic stroke. Intracerebral microhemorrhages started to appear 48 h after MCAO (24 h after cells injection) and then increased. SPIO-labeled cells can be distinguished from hemorrhagic transformations and also cerebral vessels by analyzing their shape and time of appearance. Zones of hemorrhagic transformations confirmed by brightfield microscopy (Perl’s blue staining). Scale bars: 500 μm.

