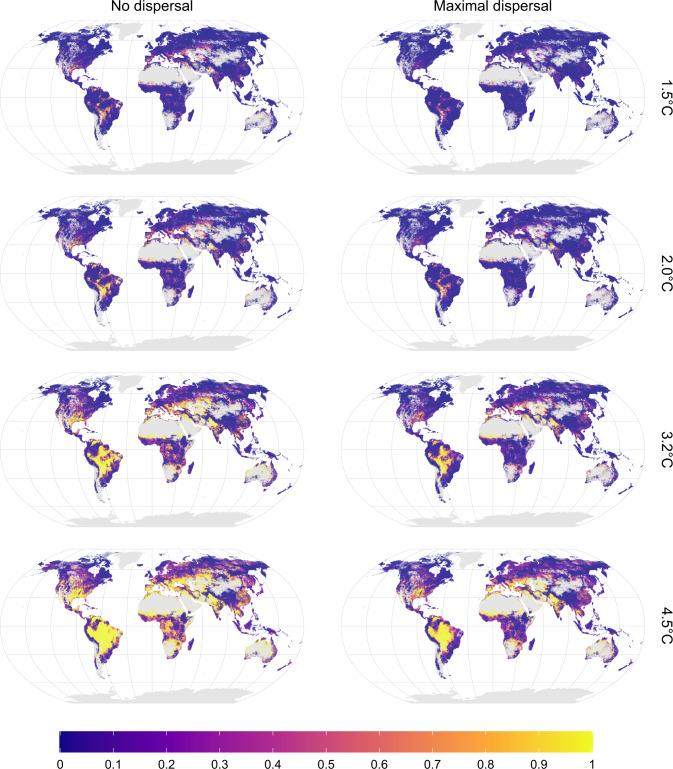
Fig. 2. Spatial patterns of climate change threat.
Potentially affected fraction (PAF) of freshwater fish species due to exposure to water flow and temperature extremes beyond current levels, for different global warming levels and two dispersal assumptions. Patterns are based on the median PAF across the GCM–RCP combinations at a five arcminutes resolution (~10 km). Gray denotes no data areas (no species occurring or no data available). Source data are provided as Supplementary Data 2 and 3.

