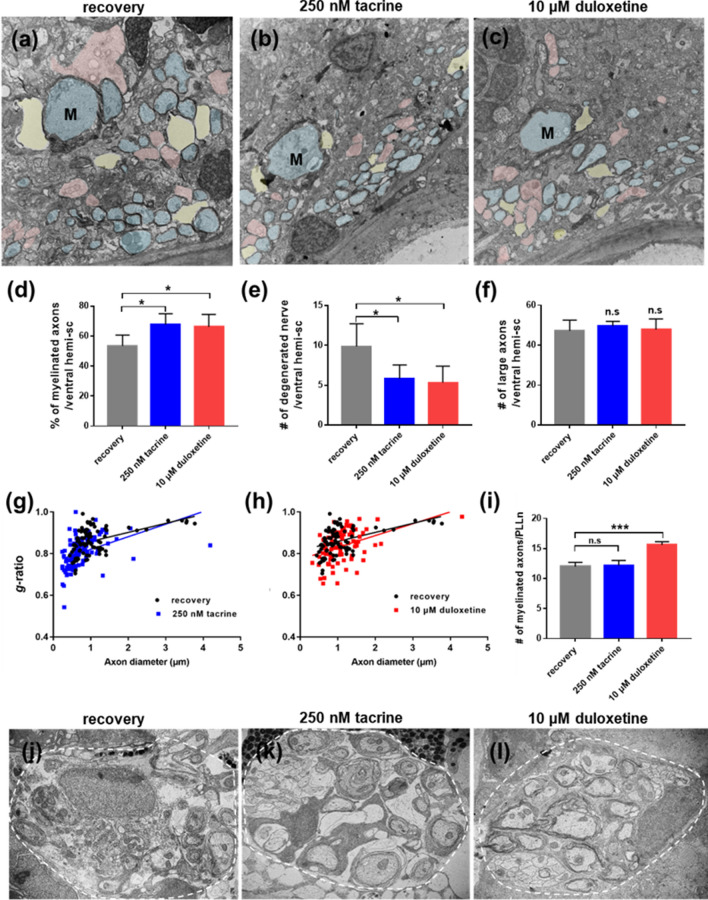
Figure 4.
Tacrine and duloxetine promote remyelination after demyelination. Transmission electron microscopic images of transverse sections of the Tg(mbp:gal4-vp16;uas:gfp;uas:NTR-mCherry) larvae, with anterior to the left and dorsal to the top. (a–c) Representative images of ventral hemi-sections. M indicates Mauthner axon. Pseudo-colors were used to distinguish different degrees of myelination: blue indicates myelinated axons, pink indicates non-myelinated axons, and yellow indicates degenerated nerve structures. Scale bar, 2 μm. (d) Percentage of myelinated axons per ventral hemi-section. recovery: 53.4% ± 7.23, 250 nM tacrine: 69.2% ± 6.94, 10 μM duloxetine: 66.17% ± 8.23. (e) Quantification of the number of degenerated nerve structures per ventral hemi-section. Recovery: 9.86 ± 2.85; 250 nM tacrine: 5.83 ± 1.72; 10 μM duloxetine: 55.3 ± 2.07. (f) Quantification of the number of large caliber axons (> 1 μm) per ventral hemi-section. Recovery: 47.2 ± 5.36; 250 nM tacrine: 49.6 ± 2.30; 10 μM duloxetine: 47.8 ± 5.36. n = 5 for the recovery groups; n = 6 for the tacrine and duloxetine groups (g, h) Decreased g-ratio in myelinated axons in tacrine-treated larvae (blue line) and duloxetine-treated larvae (red line) compared to MTZ-treated larvae (black line); g-ratios: 0.86 ± 0.063; 250 nM tacrine: 0.81 ± 0.072, p < 0.001; 10 μM duloxetine: 0.4 ± 0.073, p < 0.05; n = 3. (i) Quantification of the number of myelinated axons per PLLn. Recovery: 12 ± 0.71, 250 nM tacrine: 12.2 ± 0.84, 10 μM duloxetine: 15.6 ± 0.55. (j–l) Representative sectioned images of PLL. Scale bar, 1 μm. ***p < 0.001; *p < 0.05; n.s., not significant.

