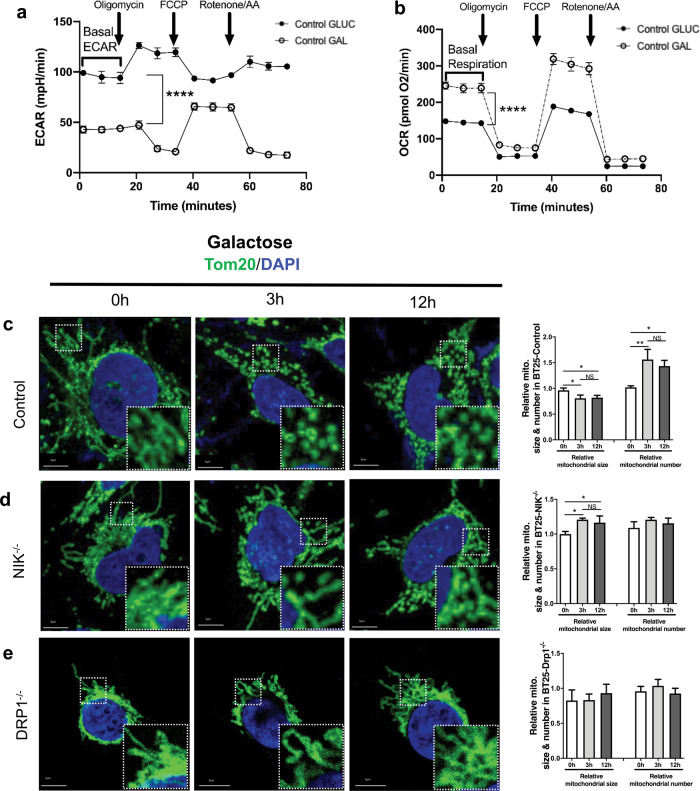
Fig. 2. Metabolic shift from glycolysis to OXPHOS triggers NIK-dependent mitochondrial fission.
a Representative Seahorse XF Cell Mito Stress test showing extracellular acidification rate (ECAR) of BT25 control cell in glucose and galactose media. Bracket indicates significance between basal ECAR between the conditions. Student’s t test (paired, two tailed) p < 0.0001. b Change in O2 consumption rate (OCR) plotted as pmol O2 per minute. Brackets indicate significantly different basal respiration. Student’s t test (paired, two-tailed) p < 0.0001. c–e Representative confocal images of BT25 control, NIK−/−, and DRP1−/− cells grown in 18 mM glucose and shifted to 18 mM galactose for the indicated time points and immunostained with a Tom20-FITC-conjugated antibody. Areas marked with white squares are amplified and shown in the insert. Scale bar, 5 μm. DRP1 knockdown was verified by immunoblot (Supplementary Fig. 4) and NIK−/− cells were described previously20. Quantification of mitochondria size and number of control, NIK−/−, and DRP1−/− cells pictured to the right of each image respectively. Mitochondria was quantified using Image J and significance was determined by one-way ANOVA followed by Tukey post-hoc analysis (n ≥ 30 cells per cell condition); *p < 0.05, **p < 0.01, ns: not significant.

