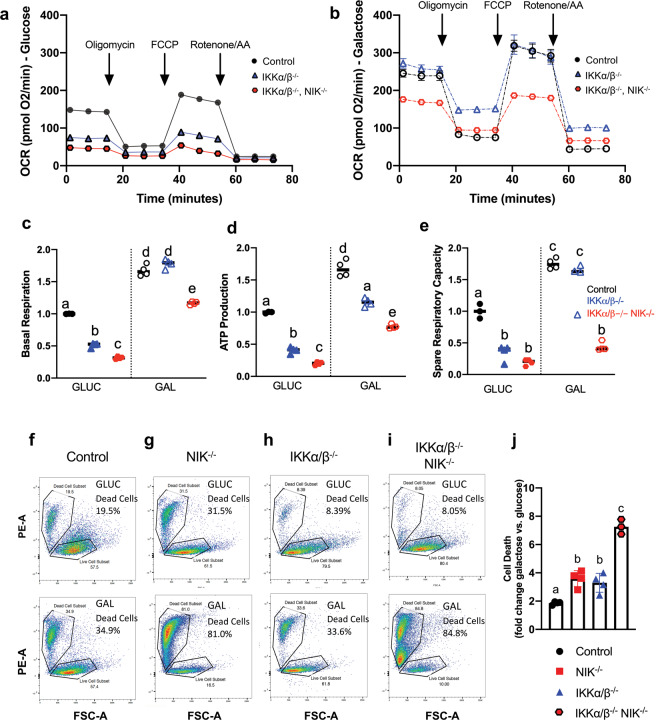
Fig. 5. NIK regulation of mitochondrial metabolism and cell survival is independent of IKK.
a, b Oxygen consumption rate (OCR) was measured using the Seahorse Mito Stress test with control cells (see Figs. 2b and 4a, b), IKKα/β−/− cells and IKKα/β−/−, NIK−/− lines that were cultured in 18 mM glucose (GLUC) (a) or 18 mM galactose (GAL) media (b). Data shown are the mean ± SD of ≥3 replicates for each cell type in each condition and are representative of at least three independent experiments. OCR values were normalized to cellular DNA content (DRAQ5 relative fluorescence units (RFUs)). c–e Individual mitochondrial function parameters were calculated from the data shown in a and b and shown as fold change compared to control cells in GLUC. Data for control cells was taken from Fig. 2b. c Basal respiration. Different letters indicate statistical significance using one-way ANOVA with Tukey post-hoc test. All comparisons have p < 0.0001 except “a vs e” (p < 0.01), “b vs c” (p < 0.001). d ATP production. All statistical comparisons have p < 0.0001 except “a vs e” (p < 0.01), and “b vs c” (p < 0.01). e Spare respiratory capacity. All statistical comparisons have p < 0.0001 except “a vs b” (p < 0.01), “a vs c” (p < 0.05). f–i Representative Flow cytometry analysis of cell death using propidium iodide staining. Indicated BT25 GBM cells were grown for 48 h in either 18 mM glucose (upper panels) or galactose media (lower panels). j Fold change in cell death induced by shifting from GLUC to galactose media for 48 h (% dead cells in galactose / % dead cells glucose). Different letters indicate statistical significance using one-way ANOVA with Tukey post-hoc test. For “a vs b” p < 0.05, “b vs c” p < 0.0001; n = 3–4 independent experiments, n ≥ 10,000 cells per condition. Error bars indicate mean ± SD.

