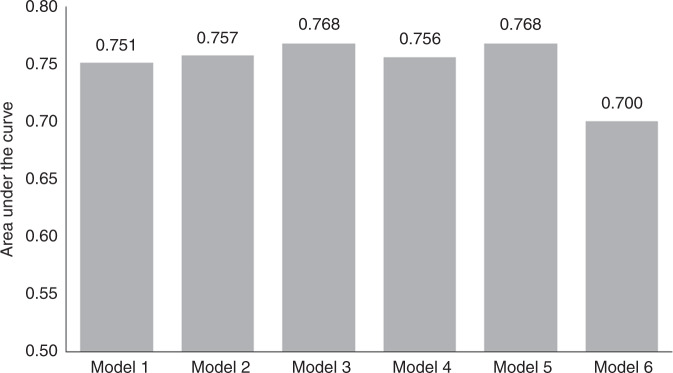
Fig. 3. Accuracy of prognostic models for recurrence risk in the whole cohort (ROC analysis).
Model 1: Minimal tumour-free distance (TFD), number of positive lymph nodes (LN); Model 2: TFD binarised, LN positivity binarised; Model 3: TFD binarised, LN positivity binarised, lymphovascular space invasion; Model 4: TFD binarised, LN positivity binarised, depth of stromal invasion; Model 5: TFD binarised, LN positivity binarised, tumour type; Model 6: largest tumour size binarised, LN positivity binarised.

