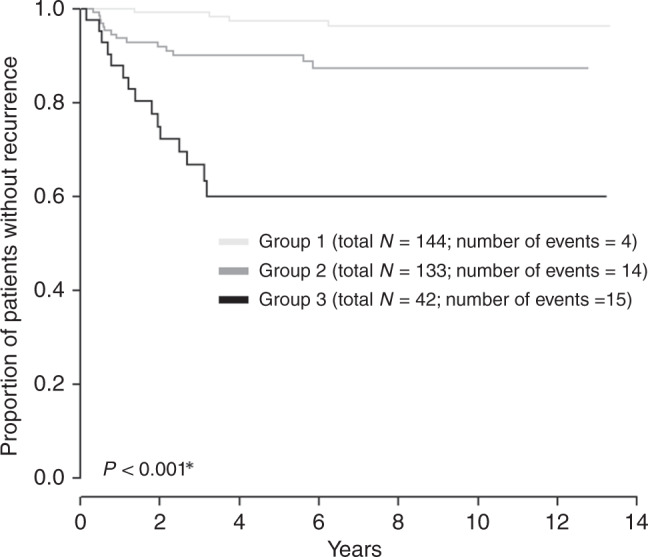
Fig. 4. Kaplan–Meier recurrence-free survival (RFS) curve for Model 2 in the whole cohort.

Group description: Group 1: tumour-free distance (TFD) > 3.5**, N0**; Group 2: TFD ≤ 3.5**, N0**; Group 3: TFD ≤ 3.5**, N1**. Two patients without event are not included in the groups: minimal tu-pcf (US) > 3.5**; a number of positive LN > 0**. *Log-rank test. **Cut-off determined by ROC analysis, the criterion was the highest value of the sum of sensitivity and specificity.
