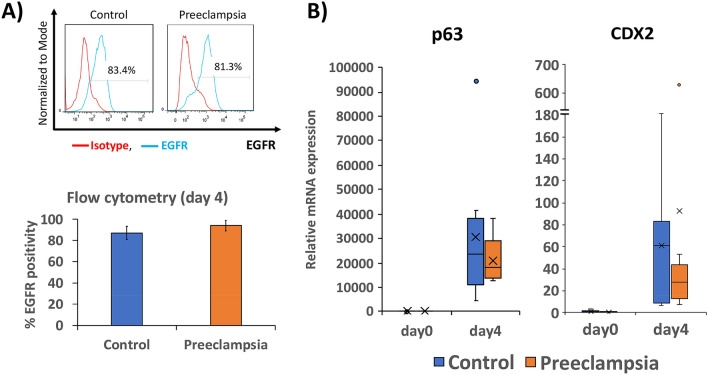
Figure 1.
Differentiation of PE- and control-iPSC into CTB-like cells. (A) Upper panel: Representative flow cytometric analysis of CTB marker, EGFR, as compared to isotype control, following differentiation of iPSC into CTB-like cells (after 4 days of BMP4 + IWP2 treatment). Lower panel: Bar chart displaying average percent EGFR positive cells from both PE- and control-iPSC at day 4 of differentiation, ± standard deviation (n = 9 for each condition). (B) Box plot displaying qPCR of CTB markers p63 and CDX2 at day 4 of differentiation, normalized to L19, and expressed as fold change over undifferentiated control-iPSC (day 0) (n = 9 for each condition).

