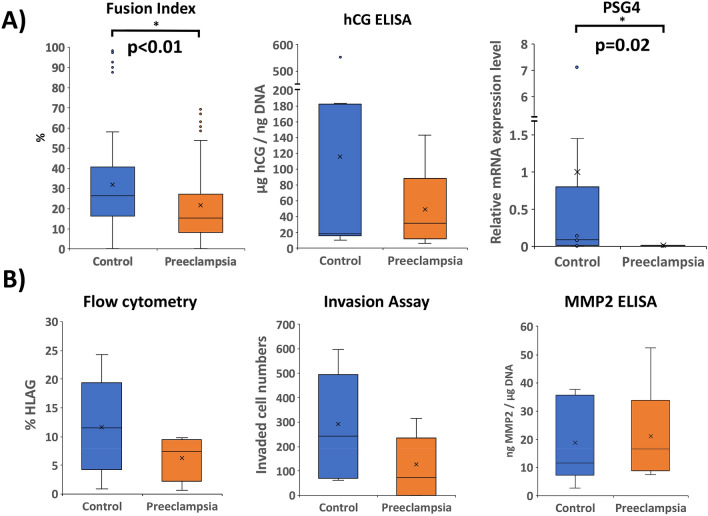
Figure 2.
Differentiation of iPSCs into either STB-like cells (performed under 21% oxygen) (A) or into EVT-like cells (performed under 2% oxygen) (B). STB formation and function (A) was assessed by calculation of fusion index, hCG secretion (normalized to DNA content), and PSG4 expression level (by qPCR, normalized to L19, and shown as fold change compared to control-iPSC in the same differentiation state). EVT formation and function (B) was assessed by expression of surface HLA-G as measured by flow cytometry, invasive capacity as assessed by Matrigel invasion assay, and MMP2 secretion (normalized to DNA content). *Indicates statistical significance by Mann–Whitney U, with p values as stated (n = 9 for each condition).

