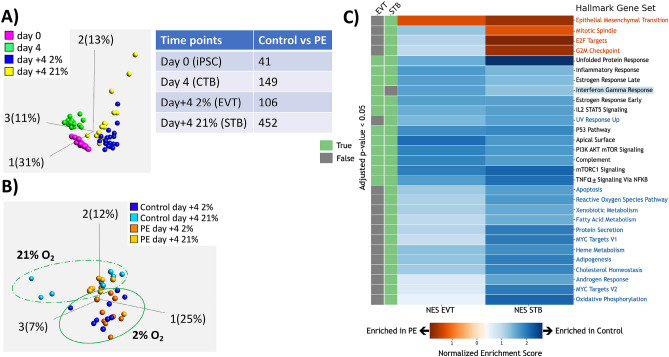
Figure 4.
Analysis of RNAseq data with respect to differentiation state. Data from iPSC at day 0 (iPSC), and iPSC-derived trophoblast at day 4 (cytotrophoblast/CTB-like), day + 4 at 2% oxygen (extravillous trophoblast/EVT-like) and day + 4 at 21% oxygen (syncytiotrophoblast/STB-like). (A) PCA plot (left) showing iPSC at different timepoints of trophoblast differentiation, and table (right) showing the number of differentially expressed genes (DEGs) between control- and PE-iPSC at each of these time points. (B) PCA plot displaying only the day + 4 timepoints, with dashed line indicating greater difference in gene expression between control- and PE-iPSC differentiated into STB-like cells (under 21% oxygen) and solid line showing closer clustering of control- and PE-iPSC differentiated into EVT-like cells (under 2% oxygen). (C) Gene Set Enrichment Analysis (GSEA) of iPSC-derived trophoblasts at day + 4. Heatmap displays normalized enrichment score (NES), with orange color showing gene-sets enriched in PE, and blue color showing gene-sets enriched in control. Green bars (left) indicate those gene-sets with p value < 0.05 in either 2% (EVT-like state) or 21% (STB-like state) oxygen tension. Gene-sets written in orange and blue font are uniquely enriched in PE- or control-iPSC-derived trophoblast, respectively, under 21% oxygen (STB-like state). Only one pathway (highlighted in blue) was uniquely enriched in control-iPSC-derived trophoblast under 2% oxygen (EVT-like state).

