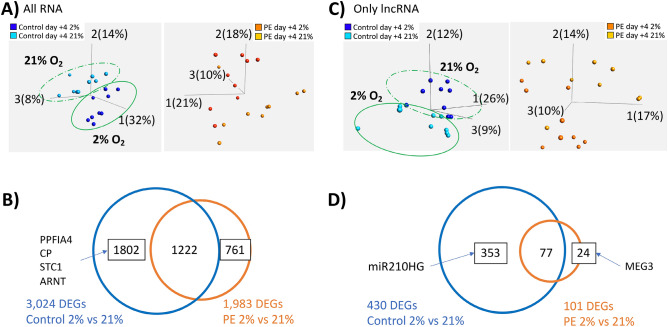
Figure 5.
Analysis of RNAseq data with respect to response to oxygen tension. (A) PCA plot displaying either control-iPSC-derived trophoblast (left), or PE-iPSC-derived trophoblast (right). Trophoblast derived from control-iPSC separate much more clearly based on oxygen tension, compared to those derived from PE-iPSC. (B) Venn diagram displaying the number of DEGs between different oxygen tensions (2% vs. 21%) within the same disease condition (control and PE). Boxed numbers indicate DEGs unique to either iPSC group, with gene symbols indicating a handful of these unique genes in trophoblast derived from control-iPSC. (C) PCA plot displaying only long non-coding RNAs (lncRNAs) in either control-iPSC-derived trophoblast (left), or PE-iPSC-derived trophoblast (right). Based on analysis of this RNA subset, trophoblast derived from control-iPSC again separate much more clearly based on oxygen tension, compared to those derived from PE-iPSC. (D) Venn diagram displaying the number of differentially expressed lncRNAs between different oxygen tensions (2% vs. 21%) within the same disease condition (control and PE). Boxed numbers indicate number of differentially expressed lncRNAs unique to either iPSC group, with gene symbols indicating unique lncRNAs in either group.

