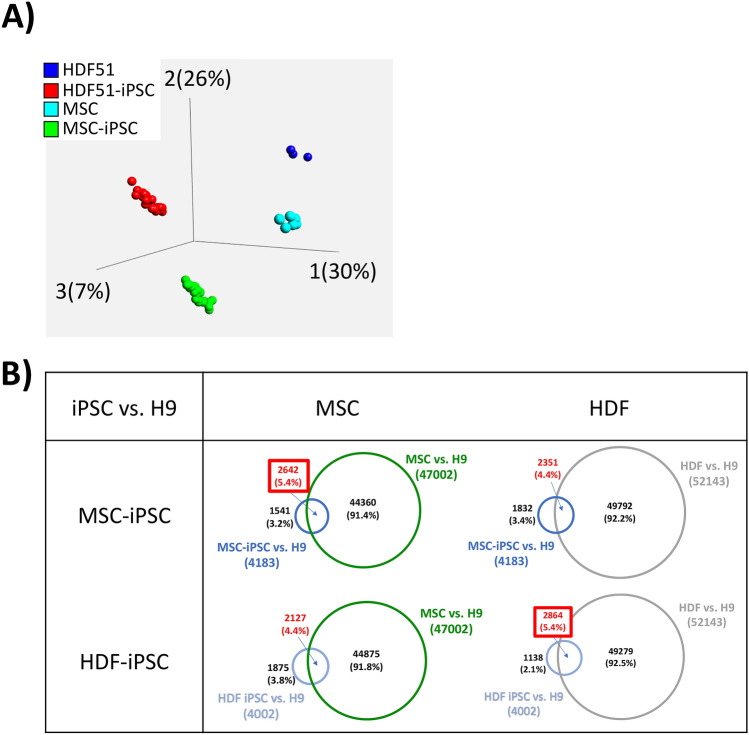
Figure 6.
DNA methylation analysis, comparing iPSCs to their cells-of-origin. (A) PCA plot displaying methylation data from our 6 mesenchymal stem cells (MSC) and 18 MSC-derived iPSC (3 iPSC clones per MSC), and previously-obtained methylation data from human dermal fibroblasts (HDF) and HDF-derived iPSCs. (B) Table displaying the number of differentially expressed probes (DMP) shared with H9/WA09 human embryonic stem cell line, using Venn diagrams. Overlapping probes of each combination were compared, with each cell type having a higher number of overlapping DMPs when compared to iPSC of the same cell-of-origin. DMPs were determined using a Δβ-value of 0.3 or above; cross reacting and sex chromosome probes were excluded from this analysis.

