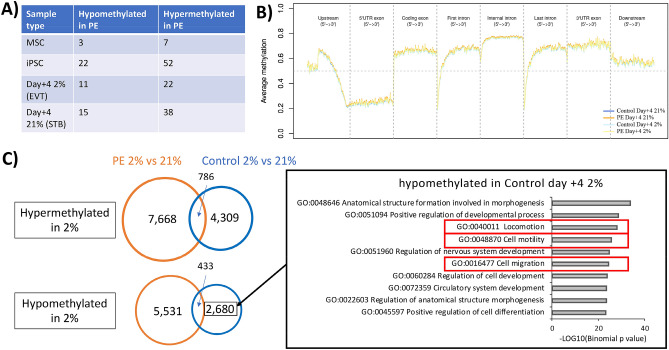
Figure 7.
DNA methylation analysis with respect to iPSC phenotype. (A) Table displaying the number of DMPs between PE and control MSC, undifferentiated iPSC, and iPSC at day + 4 of differentiation (at either 2% or 21% oxygen) (n = 6 for each comparison). DMPs were determined using a Δβ-value of 0.3 or above; cross reacting and sex chromosome probes were excluded from this analysis. (B) Average β-value plot showing PE and control at day + 4 differentiation, with genomic regions around coding genes. (C) Venn diagram showing the number of DMPs (based on trichotomized data), hyper- or hypo- methylated in either control- or PE-iPSC-derived trophoblast, with summary of GREAT output and top 10 GO terms from DMPs uniquely hypomethylated in control-iPSC derived trophoblast under 2% oxygen, displayed in the right panel.

