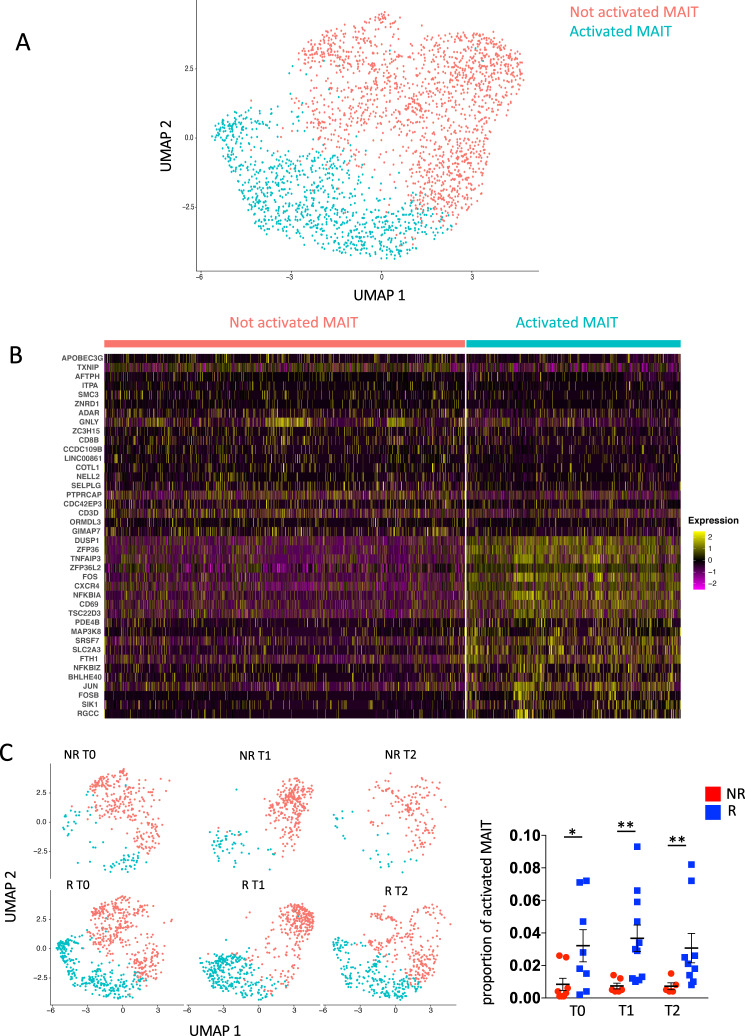
Fig. 3. Activated MAIT cells with homing properties are more abundant in responders.
A UMAP plot of MAIT cells. Not activated MAIT are in salmon and activated ones are in light blue. B Heatmap displaying scaled-expression values of discriminative gene set per each cluster of MAIT cells. A list of representative genes is shown on the left. C Left part: UMAP plot representing two clusters of MAIT cells between R and NR at T0, T1, T2. Right part: Proportion of activated MAIT cells between R and NR at T0, T1, T2. *p = 0.04; T1, **p = 0.005; T2, **p = 0.007. Statistical analysis by two-sided Mann–Whitney nonparametric test, Bonferroni’s multiple comparisons test. T0 = before therapy, T1 = after 1 cycle of therapy, T2 = after two cycles of therapy. Individual measurements of NR = 8, R = 11. Source data are provided as a Source Data file.

