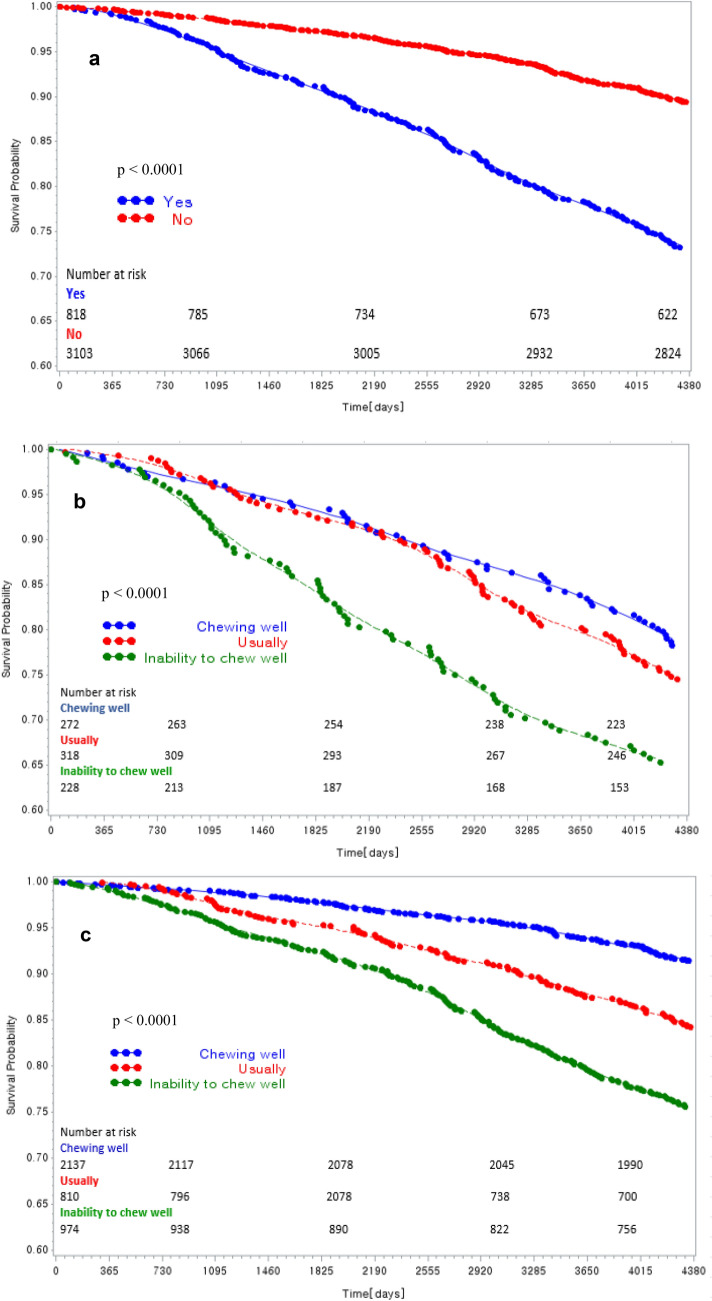
Figure 2.
Kaplan–Meier plot showing the mortality, by the denture use and chewing abilities, in the regular exercise group. The Kaplan–Meier curve is an estimator of the survival function. The Kaplan–Meier curve is the visual representation of this function and shows the probability of an event at a given time interval. The p value is for the log-rank test. (a) The cumulative mortality based on the denture use (b) The cumulative mortality based on the chewing ability of denture users (c) The cumulative mortality rate based on the chewing ability of denture non-users.

