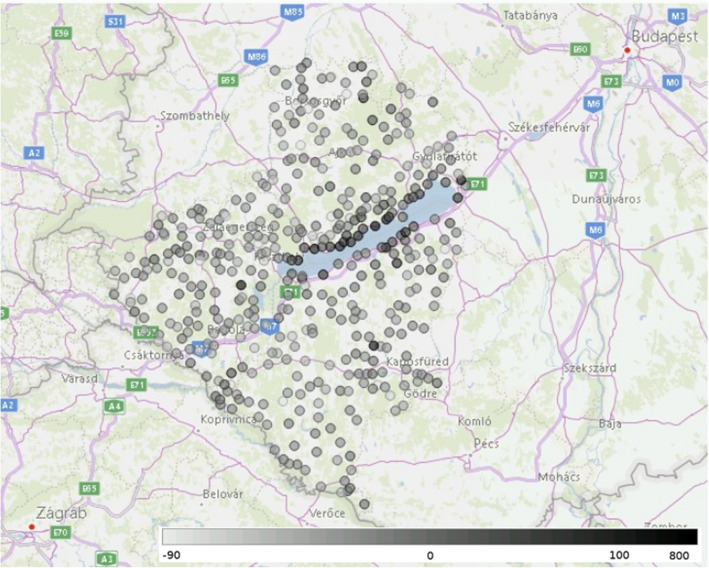
Figure 4.
The changes in the mobility index in the settlements (each represented by a shaded circle) around one favourite holiday place in Hungary, the lake Balaton on 5 April 2020. Lighter grey colouring represents a decrease in mobility compared to the reference day, while darker grey colouring represents an increase. (Created by Microsoft Power BI Pro software, Microsoft Corporation, 2020. Version: 2.85.985.0 64-bit https://powerbi.microsoft.com/hu-hu/power-bi-pro/).

