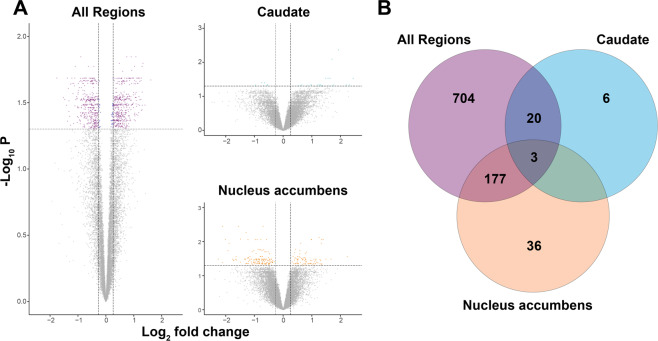
Fig. 1. Volcano plots of differentially expressed genes between obsessive-compulsive disorder (OCD) subjects and unaffected comparison subjects.
RNA sequencing was performed on post-mortem brain tissue originating from Brodmann areas 11 and 47 (OFC), the caudate, and the nucleus accumbens of 7 OCD subjects and 8 unaffected comparison subjects. A Left panel: differentially expressed genes were determined for all brain regions analyzed together. Upper right panel: differentially expressed genes in caudate. Lower right panel: differentially expressed genes in nucleus accumbens. The y-axis represents the (−log10P-value) and the x-axis represents the gene expression log2fold change. Vertical dashed lines (±0.26 log2 fold change) indicate gene expression differences between OCD subject and unaffected comparison subject cohorts, where upregulated genes are positive and downregulated genes are negative. The horizontal line demarcates significantly different gene expression differences between OCD subjects and unaffected comparison subjects (false discovery rate q-value <0.05; purple (≥0.26 or ≤ −0.26 log2 fold change)/blue (≤0.26 and ≥ −0.26 log2 fold change) dots = significant, gray dots = non-significant). Note: the volcano plot for the cortical regions (Brodmann areas 11 and 47) is shown in Fig. S3. B Venn diagram depicting the overlapping differentially expressed genes between all brain regions (purple), caudate (cyan), and nucleus accumbens (orange). There were no overlapping differentially expressed genes at the intersection between caudate and nucleus accumbens.

