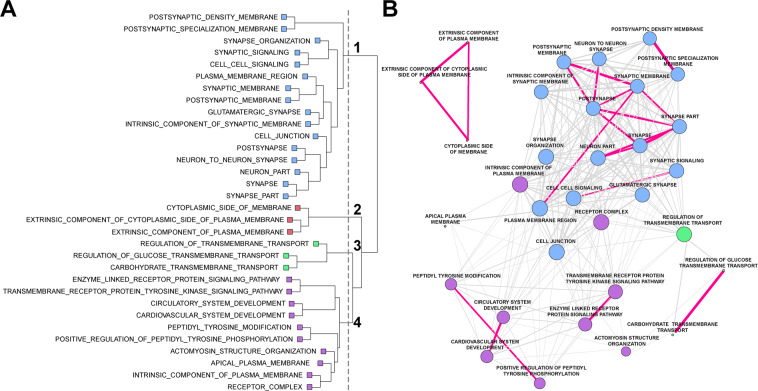
Fig. 2. Gene set enrichment analysis for obsessive-compulsive disorder (OCD).
Following RNA sequencing, global differentially expressed genes were determined between OCD subjects and unaffected comparison subjects (904 genes). Significant gene sets from the gene ontology (GO) pathways were determined using Fisher’s exact test. A Gene co-occurrence cluster dendrogram for gene set enrichment in OCD. Following gene set enrichment analysis, the number of co-occurring genes among the GO pathways were assessed. Four main branches were identified on the basis of the cut-point (vertical gray dashed line) established by visual inspection and color-coded per branch (blue: cluster 1; red: cluster 2, green: cluster 3, purple: cluster 4). B Cluster plot of gene sets associated with OCD. Genes were assessed using hierarchical clustering on the distances computed per gene set. The edges (lines) connecting nodes indicate the number of co-occurring OCD genes, where magenta lines have at least half of the genes co-occurring between the nodes (gene pathways), and gray lines indicate less than half of the OCD genes were co-occurring. Co-occurring genes were defined as the fraction of genes present in two pathways given the total number of unique genes represented in both pathways. The thickness of the magenta lines indicates more (thicker) or less (thinner) gene co-occurrence between two given gene sets. Note, the length of connecting vertices does not indicate distance between nodes.

