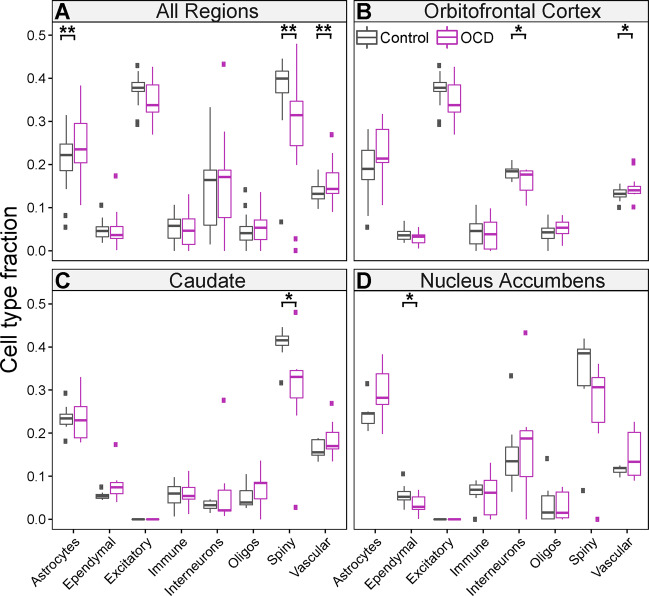
Fig. 3. Cell type fractions in OCD subjects and unaffected comparison subjects.
Cell type fractions were determined across all brain regions for OCD subjects (purple) and unaffected comparison subjects (grey) separately. Gene expression patterns in single-cell data were used to estimate the fraction of eight broadly defined cell types: astrocytes, ependymal cells, excitatory neurons, immune cells, interneurons, oligodendrocytes, medium spiny neurons (a.k.a. spiny projection neurons), and vascular cells. A Cell type fractions for global analysis (combined OFC, caudate, and nucleus accumbens). B Cell type fractions in the OFC, C Caudate, and D Nucleus accumbens. Boxplots are displayed, where ** indicates p < 0.01 and * indicates p < 0.05 (uncorrected for multiple comparisons). The mean cell type fractions were computed based on all four brain regions; however, when the cell type did not exist in the brain region, it was not included in the calculation. Thus, the mean cell type fraction for the excitatory neurons was based only on the cortical regions and the mean cell type fraction for spiny projection neurons was based on the caudate and nucleus accumbens regions.

