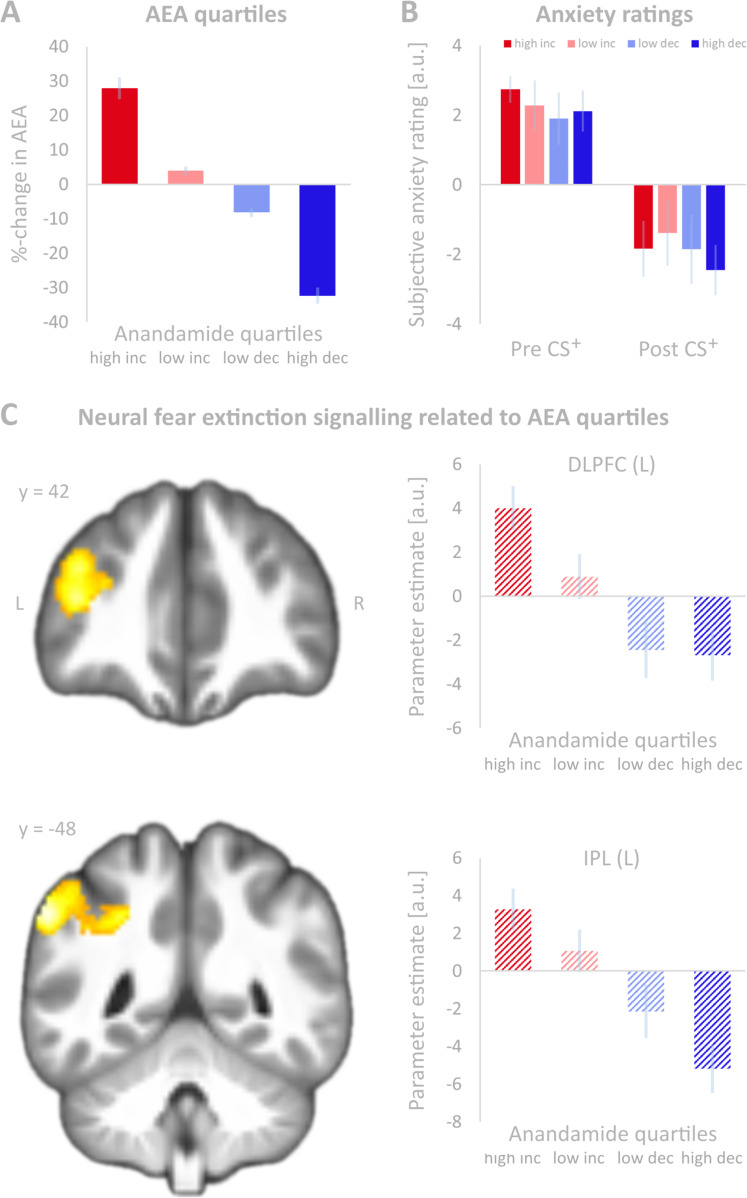
Fig. 3. Anandamide (AEA) quartiles, anxiety ratings and neural fear extinction signalling related to AEA quartiles.
A Relative changes (in per cent, %) in anandamide (AEA) plasma levels before and after fear extinction (day 2) grouped in quartiles (quartile 1: high increase (n = 13), quartile 2: low increase (n = 13), quartile 3: low decrease (n = 12), quartile 4: high decrease (n = 13)). Error bars denote standard errors of the mean. B Average subjective anxiety ratings before (pre) and after (post) fear extinction (day 2) for the CS+ grouped according to changes in AEA (quartiles 1–4). A rating of 0 indicates no feeling of fear in association with the stimulus, 10 indicates the greatest fear. Error bars denote standard errors of the mean. C Group-wise (AEA quartile model) comparison of cerebral networks showing an exponential decay during fear extinction learning. Significance was assessed at p < 0.001 (voxel level) and p < 0.05 (FWE-corrected) at the cluster-level (corresponding to 169 voxels). The statistical parametric map was overlaid on sagittal sections of the group averaged T1 image. For demonstration purposes, fMRI sectional views were extracted from more conservative analyses with smaller cluster sizes. Coordinates refer to MNI space. MFG middle frontal gyrus, IPL inferior parietal lobule, INC increase in AEA during fear extinction, DEC decrease in AEA during fear extinction.

