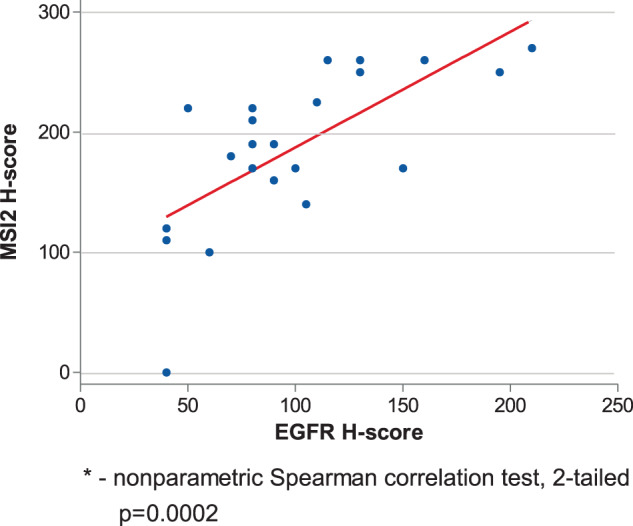
Fig. 6. Expression of MSI2 and EGFR proteins in human NSCLC primary tumors.

A H scores for MSI2 and EGFR in EGFRmut NSCLC tumor TMA samples (see Supp Table S4 for clinical characteristics). For MSI2 and EGFR IHC quantification, each spot was examined by board-certified pathologists (ED and NK) who assigned a score of 0 (no staining), 1+ (weak staining), 2+ (moderate staining), and 3+ (strong staining) within carcinomatous areas. The score for each of the two tumor spots was averaged for statistical analysis. The H-score, which ranges from 0 to 300, was calculated using the following formula: [1(% cells 1+) + 2 (% cells 2+) + 3 (% cells 3+)], which reflects staining intensity as well as percentage of positive cells46,47.
