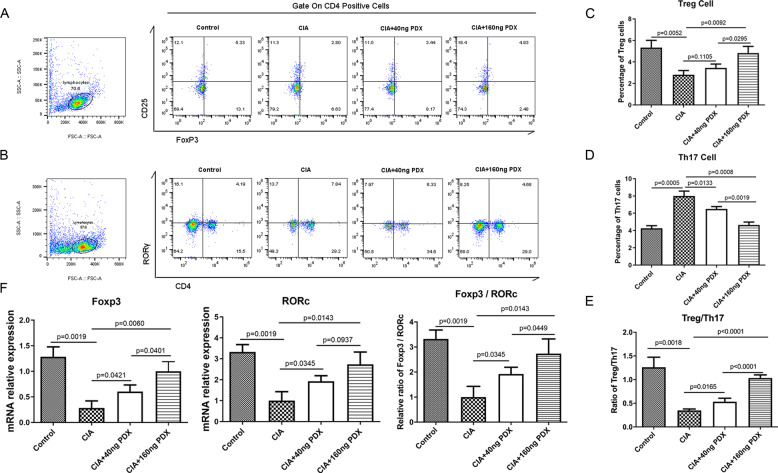
Fig. 3. PDX regulated Treg/Th17 cell balance in CIA mice.
A–D Percentages of Th17 cells and Tregs from PDX-treated CIA mouse lymph nodes as shown by FCM (F[4, 12] = 61.37 and F[4,12] = 14). E Ratio of Tregs to Th17 cells from PDX-treated CIA mice (F[4,12] = 72.83). F mRNA expression of RORγ and FOXP3, and FOXP3/RORγ ratio, in lymphocytes from PDX-treated CIA mice, as shown by RT-qPCR (F[4, 12] = 16.86 for RORγ, F[4,12] = 21.32 for FOXP3 and F[4,12] = 19.56 for FOXP3/RORγ). Data were presented as means ± SD. Differences among the three groups were assessed using one-way ANOVA, and post hoc tests (Tukey’s method) were applied to investigate the differences one by one.

