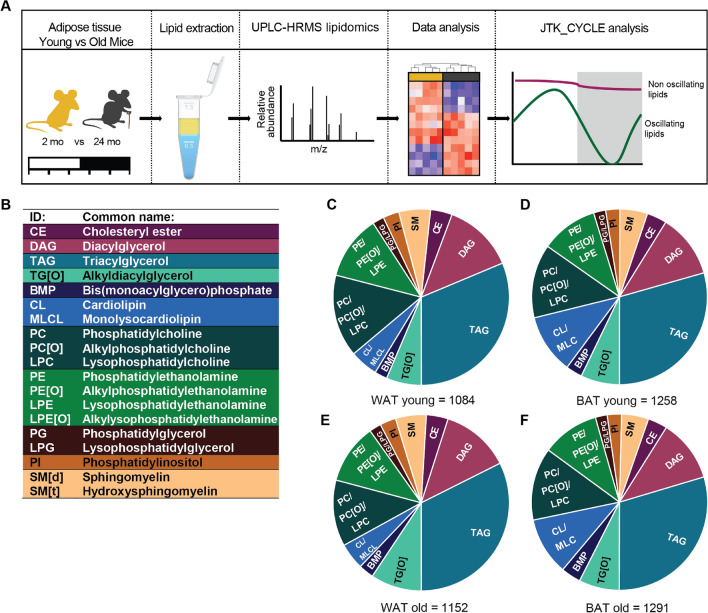
Figure 1.
Lipid profiling in WAT and BAT of young and aging mice. (A) Experimental design: 2 and 24 months old mice were sacrificed every 4 h; WAT and BAT was harvested and lipids were extracted; lipidomics and data analysis was performed; and the obtained lipid profiles were analyzed with JTK_CYCLE analysis for detection of oscillating lipids. (B) The abbreviations and common names of the 19 detected lipid classes. The lipid composition of young mice in WAT (C), BAT (D), and of aged mice in WAT (E) and in BAT (F). Illustration and figure layout were prepared in Adobe Illustrator CS6 (v16.0.3; https://www.adobe.com/nl/). Pie charts were created in Graphpad Prism (v8.3.0; https://www.graphpad.com/scientific-software/prism/).

