Figure 2.
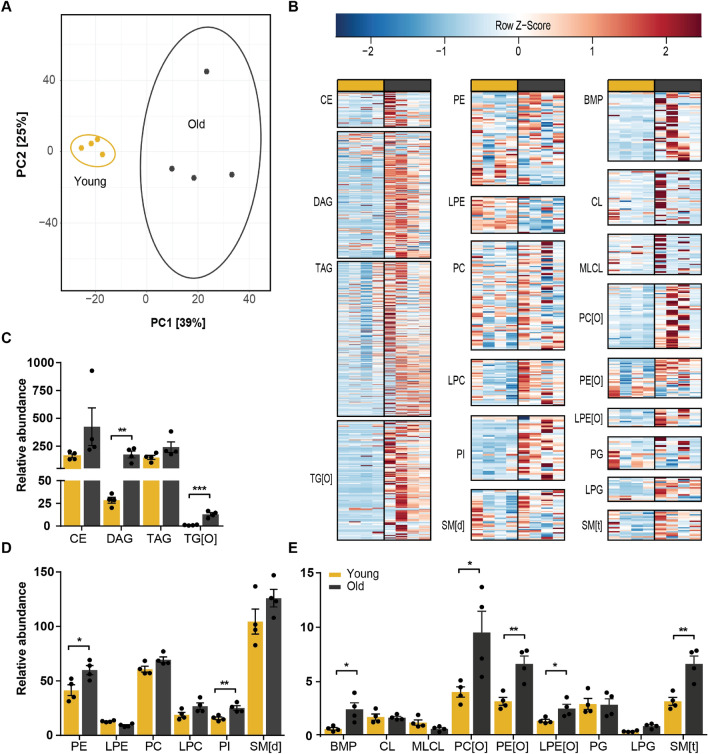
Global accumulation of lipids in aged WAT. (A) Principal component analysis of young and aged mice WAT lipidome shows clear separation. (B) Heatmaps of all lipid classes arranged from left to right by lipid abundance and ordered from top to bottom by acyl chain length. Relative abundance of (C) sterol and glycerolipids; (D), (E) glycerophospholipids and sphingomyelins show accumulation of almost all lipid classes. *P < 0.05, **P < 0.01, ***P < 0.001 (unpaired Student’s t-test) (n = 4). PCA analysis and heatmaps were created in R programming language (v3.6.3; http://www.r-project.org). Bar graphs were created in Graphpad Prism (v8.3.0; https://www.graphpad.com/scientific-software/prism/). Figure layout was prepared in Adobe Illustrator CS6 (v16.0.3; https://www.adobe.com/nl/).

