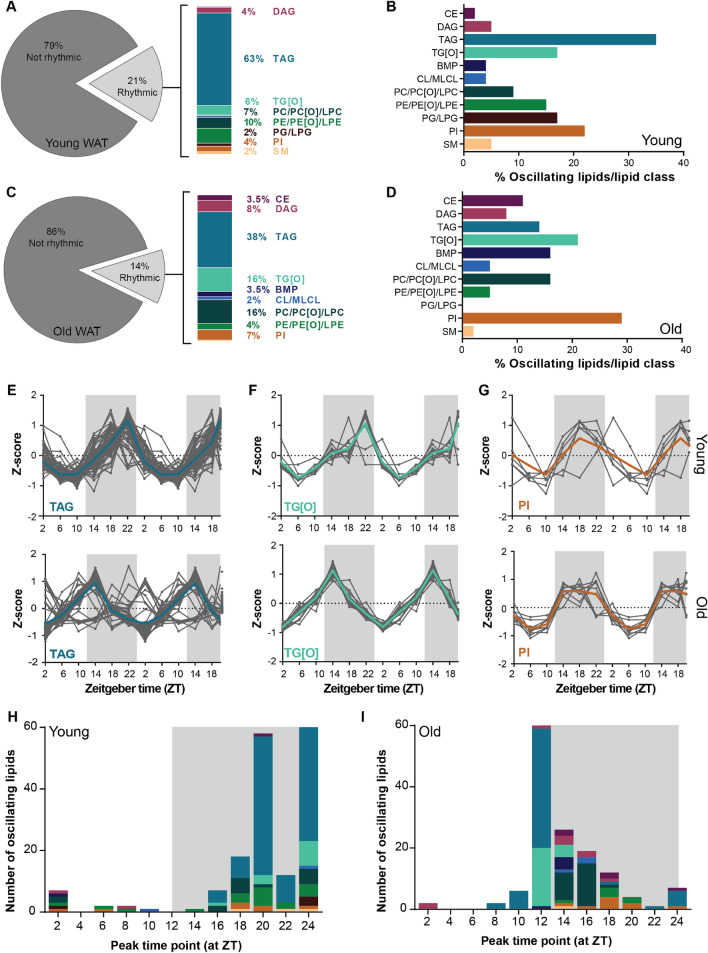
Figure 4.
In WAT aging reduces number of rhythmic lipids and advances the lipid peak phase. (A) Percentage of rhythmic lipids in young and (C) aged mice as considered by JTK_CYCLE analysis. The rhythmic lipids were of different classes. Depiction of the rhythmic/lipid class percentage of young (B) and (D) aged mice. Double plotted rhythmic profiles of (E) TAGs, (F) TG[O]s and (G) PIs in young mice compared to aged mice. The gray lines represent the individual lipid species and the bold colored lines the group average. The data were double plotted to increase the visibility of day/night rhythms. The peak time point of individual lipids species depicted with the color to their corresponding lipid class of young (H) and (I) aged mice (n = 4 per time point). Graphs were created in Graphpad Prism (v8.3.0; https://www.graphpad.com/scientific-software/prism/). Figure layout was prepared in Adobe Illustrator CS6 (v16.0.3; https://www.adobe.com/nl/).

