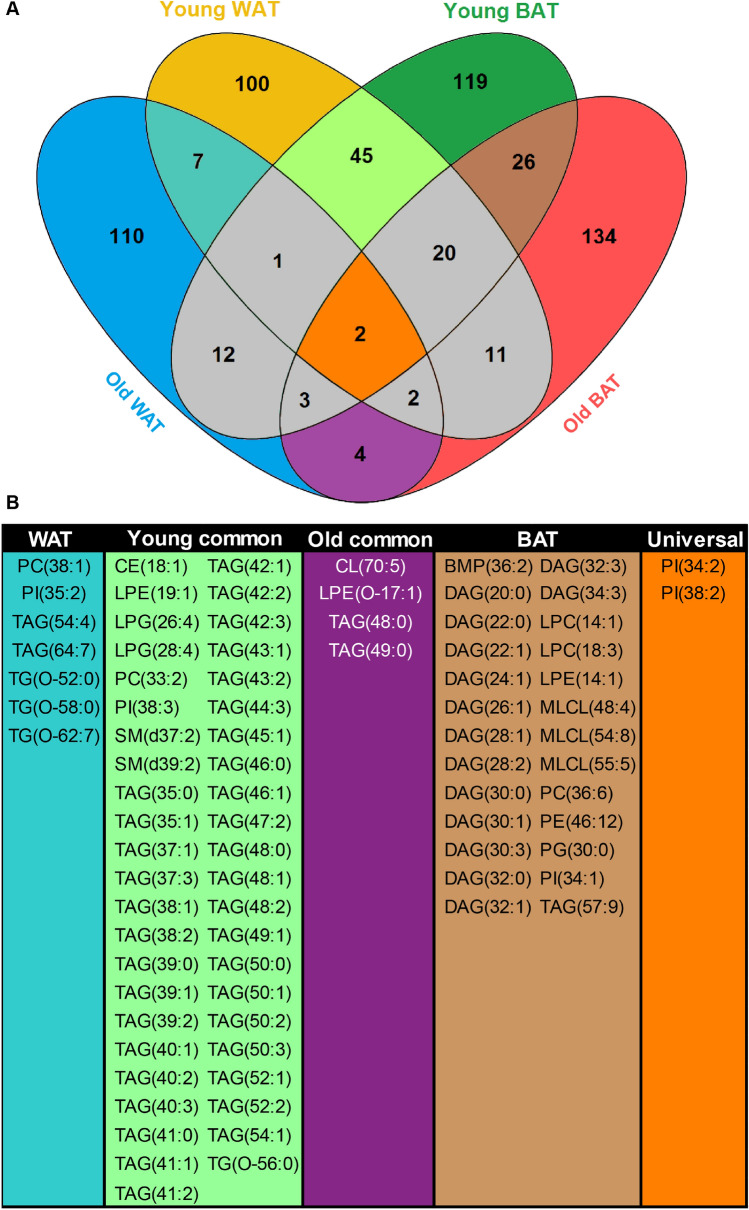
Figure 6.
Overlap of rhythmic lipids in WAT and BAT upon aging. (A) Venn diagram depicts the number of unique and shared rhythmic lipid species of young and old WAT and BAT. The interesting areas of overlap and the number unique lipids are depicted in color. (B) Individual lipids species that are rhythmic in young and old WAT(WAT); in young WAT and BAT (Young common); in old WAT and BAT (Old common); in young and old BAT (BAT) and in all groups (Universal) as depicted in Venn diagram. Venn diagram was created in Venny (v2.1.0; https://bioinfogp.cnb.csic.es/tools/venny/). Figure layout was prepared in Adobe Illustrator CS6 (v16.0.3; https://www.adobe.com/nl/).

