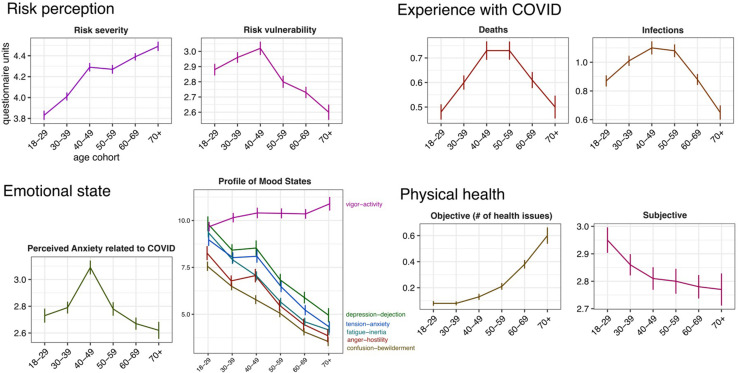
FIGURE 1.
Age-related differences in risk perception, emotional state, experience with COVID-19, and physical health. The horizontal axes indicate the age cohorts. Units on the vertical axes correspond to standard units of the questionnaires used (see text for details). Error bars represent standard error of the mean. For emotional state, experience with COVID-19 and physical health, age cohorts were computed for presentation purposes only.

