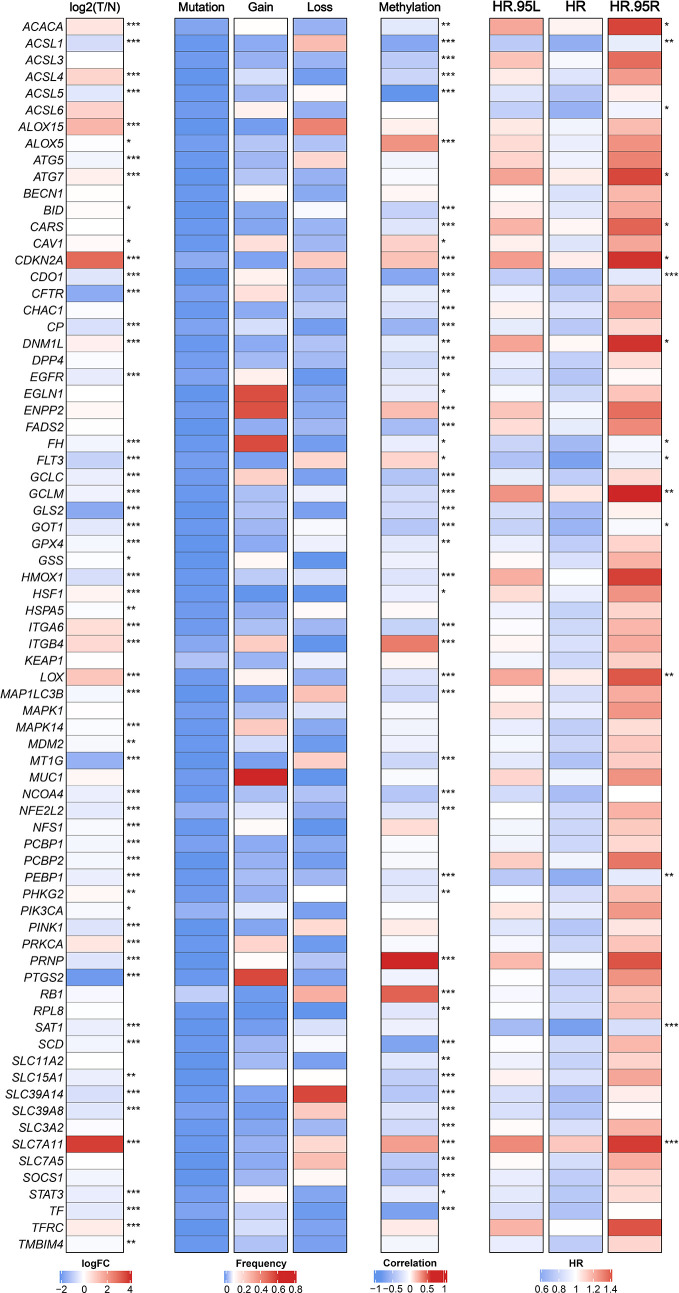
Figure 1.
The expression, genomic variation and hazard ratios of FRGs in TCGA-LIHC. From left to right panel, the expression difference of FRGs in tumor tissues compared with normal tissues, the mutation and copy number variation frequency of FRGs, the correlation of DNA methylation modifications and expression for FRGs, and univariate Cox regression analysis presented hazard ratios of FRGs. *p < 0.05, **p < 0.01, ***p < 0.001.

