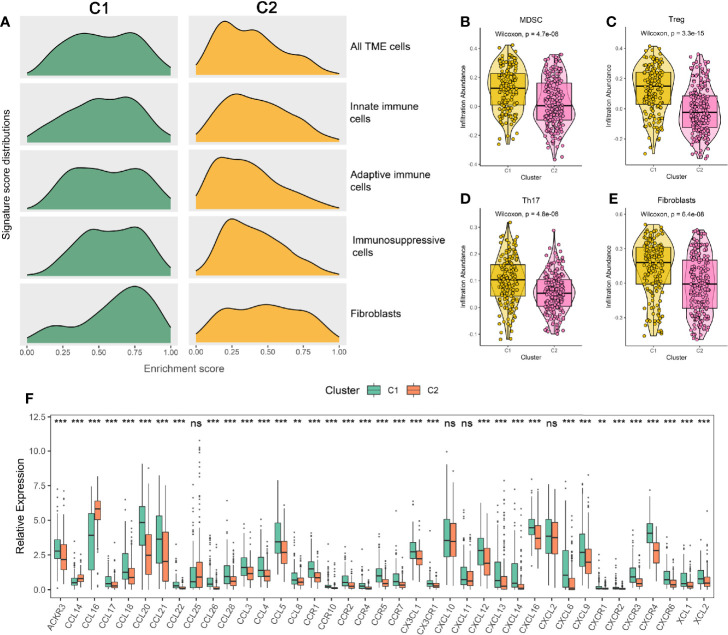
Figure 4.
(A) Signature score distributions of five cell subsets between the two subtypes. (B–E) Comparison of MDSC (B), Treg (C), Th17 (D), and fibroblasts (E) between the two subtypes. (F) The relative expression levels of chemokines and their ligands of the two subtypes. The asterisks represented the statistical p value (nsP > 0.05; **P < 0.01; ***P < 0.001).

