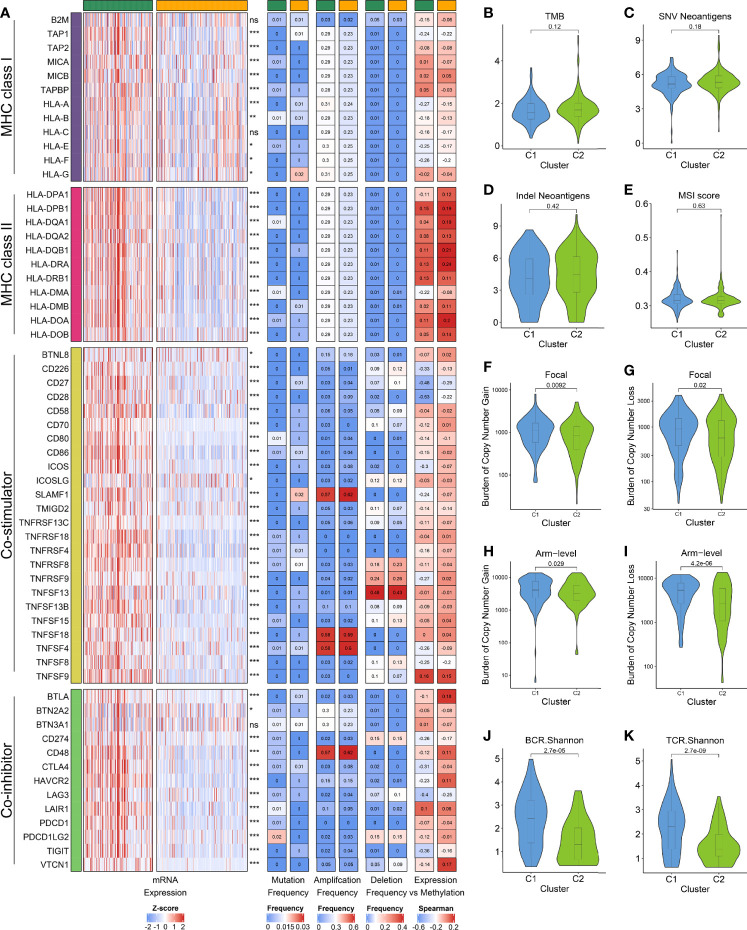
Figure 5.
(A) From left to right: mRNA expression; mutation frequency; amplification frequency; deletion frequency, and expression versus methylation (gene expression correlation with DNA methylation β value) for MHC molecules, co-stimulators and co-inhibitors in the two subtypes. (B–E) Comparison of the two subtypes in four immunogenicity associated indicators such as TMB (B), SNV neoantigens (C), indel neoantigens (D), and MSI score (E). (F–I) Comparison of the two subtypes in focal (F, G) and broad (H, I) CNV burden. (J, K) The distribution of TCR (J) and BCR (K) diversity in the two subtypes.

