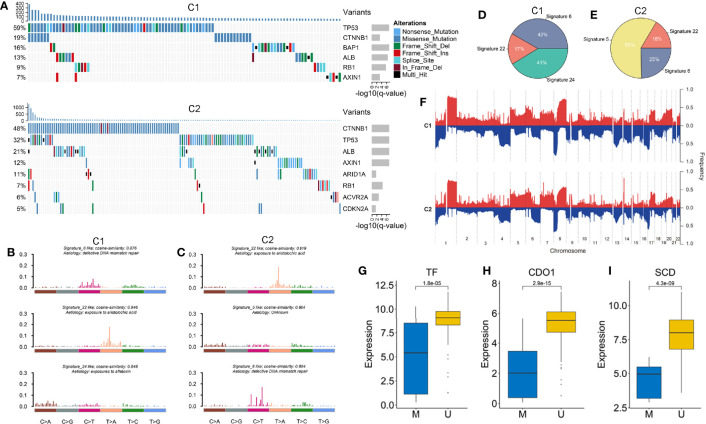
Figure 6.
(A) The waterfall plot of significantly mutation genes in the two subtypes. Each column represented individual patients. The upper barplot showed TMB, the number on the left showed the proportion of samples with mutations. The right barplot indicated the mutation frequency in each gene. (B, C) The three mutation signatures with the highest cosine similarity to COSMIC signatures in C1 (B) and C2 (C). The etiology of each signature and the cosine similarity between the original and the reconstructed mutation signatures were indicated. (D, E) The pie charts showed the proportion of the three mutation signatures contributing to the mutations spectrum of C1 (D) and C2 (E). (F) The copy number variations of the two subtypes. (G–I) The expression difference of three ESGs including TF, CDO1 and SCD between the methylated and unmethylated groups.

