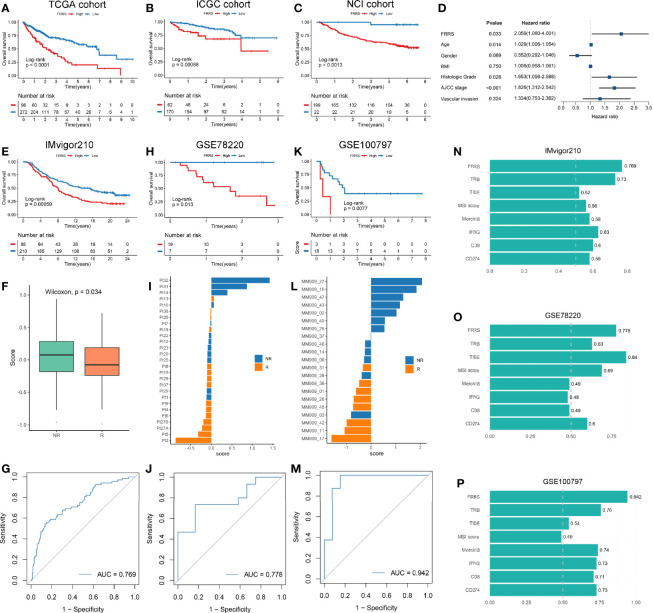
Figure 7.
(A–C) Kaplan-Meier survival analysis of high FRRS and low FRRS group in TCGA (A), ICGC (B), and NCI (C) cohorts. (D) FRRS and clinical factors were combined for multivariate Cox regression analysis. (E–G) Kaplan-Meier survival analysis of high FRRS and low FRRS groups (E), the distribution of FRRS between response and nonresponse groups (F), and ROC curve of the FRRS signature for predicting immunotherapy response (G) in IMvigor210 cohort. (H–J) Kaplan-Meier survival analysis of high FRRS and low FRRS groups (H), the distribution of FRRS between response and nonresponse groups (I), and ROC curve of the FRRS signature for predicting immunotherapy response (J) in GSE78220 cohort. (K–M) Kaplan-Meier survival analysis of high FRRS and low FRRS groups (K), the distribution of FRRS between response and nonresponse groups (L), and ROC curve of the FRRS signature for predicting immunotherapy response (M) in GSE100797 cohort. (N–P) AUC values of FRRS and seven other biomarkers for predicting the immunotherapy response in IMvigor210 (N), GSE78220 (O), and GSE100797 (P) cohorts.

